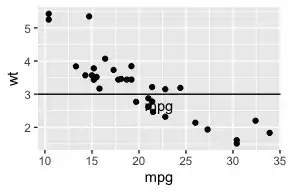
Have a look at the following plot:
ggplot(mtcars, aes(x = mpg, y = wt)) +
  geom_point() +
  geom_hline(yintercept = 3) +
  theme(axis.title.x = element_text(vjust = 85))

As you can notice, the x-axis title has been shifted and is located just below the horizontal line.
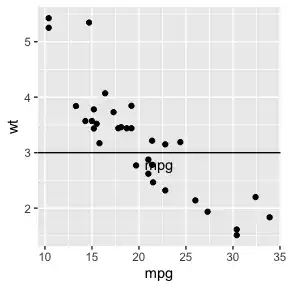
My current plot window dimensions are 17.38312 x 16.98625 cm. If I change them to smaller ones (e.g. 12.88521 x 11.08604 cm), then the plot looks like this:

So as you can see, the title is no longer in the same position, now it's above the horizontal line. If we make the plot larger (24.15646 x 20.32000 cm), then the title is much below the horizontal line.

I tried using coord_fixed(), but that didn't seem to be intended for these types of problems.
How can I ensure that when I am using hjust and vjust I am not moving the text in some absolute units, but rather in relative terms of the graph width/height, so that the text always remains in the same position when I resize the graph?