Here is (IMO) more elegant method based on belisarius's code which uses the DisplayFunction option (see here interesting discussion on this option):
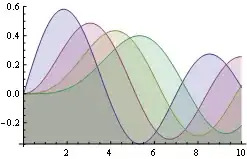
Plot[Evaluate[Table[BesselJ[n, x], {n, 4}]], {x, 0, 10},
 Filling -> Axis,
 DisplayFunction ->
  Function[{plot},
   Show[plot,
    AxesOrigin ->
     First /@ (PlotRange /. AbsoluteOptions[plot, PlotRange]),
    DisplayFunction -> Identity]]]
The only drawback of both methods is that AbsoluteOptions does not always give correct value of PlotRange. The solution is to use the Ticks hack (which gives the complete PlotRange with explicit value of PlotRangePadding added):
completePlotRange[plot_] :=
 Last@Last@
   Reap[Rasterize[
     Show[plot, Ticks -> (Sow[{##}] &), DisplayFunction -> Identity],
     ImageResolution -> 1]]
Plot[Evaluate[Table[BesselJ[n, x], {n, 4}]], {x, 0, 10},
 Filling -> Axis,
 DisplayFunction ->
  Function[{plot},
   Show[plot, AxesOrigin -> First /@ completePlotRange[plot],
    DisplayFunction -> Identity]]]
It is interesting to note that this code gives exactly the same rendering as simply specifying Frame -> {{Automatic, None}, {Automatic, None}}, Axes -> False:
pl1 = Plot[Evaluate[Table[BesselJ[n, x], {n, 4}]], {x, 0, 10},
   Filling -> Axis,
   DisplayFunction ->
    Function[{plot},
     Show[plot, AxesOrigin -> First /@ completePlotRange[plot],
      DisplayFunction -> Identity]]];
pl2 = Plot[Evaluate[Table[BesselJ[n, x], {n, 4}]], {x, 0, 10},
   Filling -> Axis, Frame -> {{Automatic, None}, {Automatic, None}},
   Axes -> False];
Rasterize[pl1] == Rasterize[pl1]

=> True