1

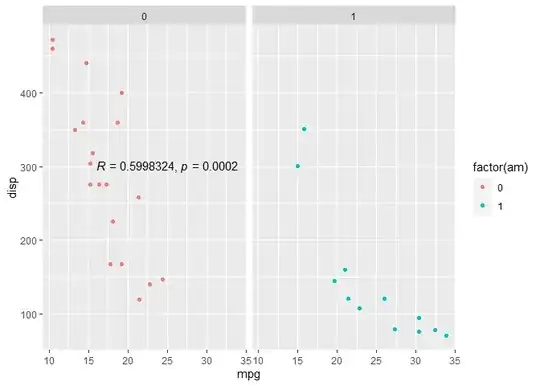
Update with the facet part the plot should look like this unless R and p (the letters) should be italic:

mtcars %>% 
  ggplot(aes(x=mpg, y=disp, color = factor(am)))+
  geom_point()+
  geom_text(aes(x = 25, y = 500,
                label = ifelse(am == 0, "R = 0.5998324, p = 0.0002", "")),
            color = "black")+
  facet_wrap(. ~ am)

enter image description here

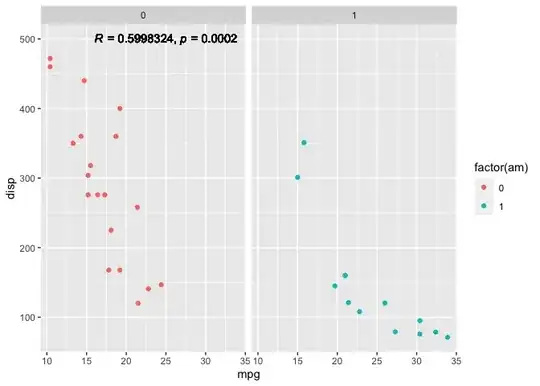
Original question I have this example plot:

library(dplyr)
library(ggplot)

mtcars %>% 
  ggplot(aes(x=mpg, y=disp, color = factor(am)))+
  geom_point()+
  geom_text(aes(x = 25, y = 300,
                label = ifelse(am == 0, expression(paste("R = 0.5998324, ", italic("p = 0.0002"))), "")),
            color = "black")

enter image description here I would like to make R and p in geom_text() italic:

I tried with expression:

mtcars %>% 
  ggplot(aes(x=mpg, y=disp, color = factor(am)))+
  geom_point()+
  geom_text(aes(x = 25, y = 300,
                label = ifelse(am == 0, expression(paste("R = 0.5998324, ", italic("p = 0.0002"))), "")),
            color = "black")

I get this error:

Don't know how to automatically pick scale
for object of type <expression>. Defaulting
to continuous.
Error in `geom_text()`:
! Problem while computing aesthetics.
ℹ Error occurred in the 2nd layer.
Caused by error in `compute_aesthetics()`:
! Aesthetics are not valid data
  columns.
✖ The following aesthetics are invalid:
✖ `label = ifelse(...)`
ℹ Did you mistype the name of a data column
  or forget to add `after_stat()`?

How could I fix? The ifelse is important because in real life I facet the data and using unicode makes it possible but changes the font!

TarJae
  • 72,363
  • 6
  • 19
  • 66
  • 1
    Why the `ifelse`? With `geom_text(aes(x = 25, y = 300), label = expression(paste(italic("R"), "= 0.5998324, ", italic("p"), "= 0.0002")), color = "black")` this works well I think – Maël May 04 '23 at 10:00
  • @Maël The same task should be applied to this code . I used a more simply code to make it minimal. – TarJae May 04 '23 at 10:17
  • 1
    Use facet in your example code, and explain how/where do you expect the text to appear. Within geom_text there is only one point 25, 300. But ifelse would return nrow(mtcars) values, not sure how ggplot supposed to handle this case. – zx8754 May 04 '23 at 10:21
  • 1
    tarjae, you will probably know, but I generally advise to use annotate(geom = "text") if you have a single label, or make a separate data frame. geom_text will make your text appear ragged as it will draw many labels. Not that this really matters for this example, but I feel that as a valued user with high reputation it would be great if you could lead our less experienced users with good (better:) code examples... – tjebo May 04 '23 at 13:38
  • 1
    @tjebo Thank you very much for your input. And I fully agree to make better code examples (which I try). But this time I was in hurry and needed just a quick solution! – TarJae May 04 '23 at 16:10

2 Answers2

1

Maybe only include a subset of data (am == 0) to geom_text? Facet still works after this.

library(tidyverse)

mtcars %>% 
  ggplot(aes(x=mpg, y=disp, color = factor(am)))+
  geom_point()+
  geom_text(data = subset(mtcars, am == 0), aes(x = 25, y = 300),
            label = expression(paste(italic("R"), " = 0.5998324, ", italic("p"), " = 0.0002")),
            color = "black", check_overlap = T) +
  facet_grid(~am)
#> Warning in is.na(x): is.na() applied to non-(list or vector) of type
#> 'expression'

Created on 2023-05-04 with reprex v2.0.2

benson23
  • 16,369
  • 9
  • 19
  • 38
1

Another option using parse=TRUE in geom_text with italic while keeping the ifelse like this:

library(tidyverse)
mtcars %>% 
  ggplot(aes(x=mpg, y=disp, color = factor(am)))+
  geom_point()+
  geom_text(aes(x = 25, y = 500,
                label = ifelse(am == 0, 'paste(italic("R")," = 0.5998324, ",italic("p")," = 0.0002")', "")),
            color = "black",
            parse = TRUE)+
  facet_wrap(. ~ am)

Created on 2023-05-04 with reprex v2.0.2

Quinten
  • 35,235
  • 5
  • 20
  • 53
  • 1
    Thank you. Your solution seems to work well with my original data. And now I also understand why I got the problem. In facet_wrap I do not use the original `am` column instead I created an `label_am` and therefore the `subset` version of @benson23 is showing the geom_text on both facets!. The only thing with your solution is that the font is getting very blurry. Do you have an idea why? – TarJae May 04 '23 at 10:41
  • 2
    You could add `check_overlap = TRUE` to remove the blurry font. This [answer](https://stackoverflow.com/questions/10952832/ggplot2-is-there-a-fix-for-jagged-poor-quality-text-produced-by-geom-text) clarifies the reason. – Quinten May 04 '23 at 10:46