A more sophisticated solution would be to use S3 dispatch, so that when you look at the whole output you only see the plot call, but when you look at the plot object, you get the actual plot drawn. This requires your main function and two print methods:
example <- function(x, y, ...) {

  plot_call <- substitute(
    plot(x = x, y = y, ...)
    )

  args <- as.list(plot_call)[-1]
  args$x <- x
  args$y <- y
  if(! "xlab" %in% names(args)) args$xlab <- deparse(substitute(x))
  if(! "ylab" %in% names(args)) args$ylab <- deparse(substitute(y))
  recording <- as.call(c(quote(plot), args))

  Plot <- structure(list(plot_call = plot_call,
                         recording = recording),
                    class = "Plot")

  structure(list(Plot = Plot,
                 Mean = c(mean(x), mean(y))),
            class = "myclass")
}

print.Plot <- function(obj, ...) {
  eval(obj$recording)
  invisible(obj)
}

print.myclass <- function(obj, ...) {
  print(list(Plot = obj$Plot$plot_call,
             Mean = obj$Mean))
  invisible(obj)
}
This gives the following behaviour:
example(x, y)
#> $Plot
#> plot(x = x, y = y)
#>
#> $Mean
#> [1] 0.1322028 0.2111516
But
example(x, y)$Plot
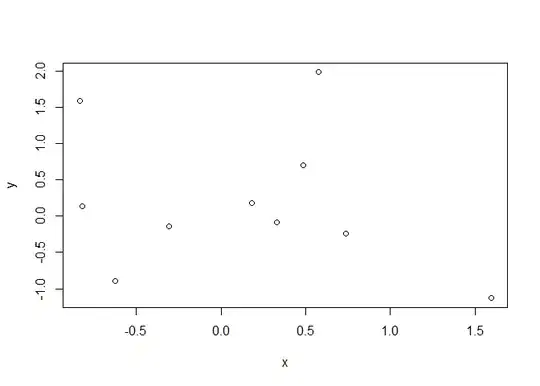
and
my_obj <- example(mtcars$wt, mtcars$mpg, col = "red")

my_obj
#> $Plot
#> plot(x = mtcars$wt, y = mtcars$mpg, col = "red")
#>
#> $Mean
#> [1]  3.21725 20.09062
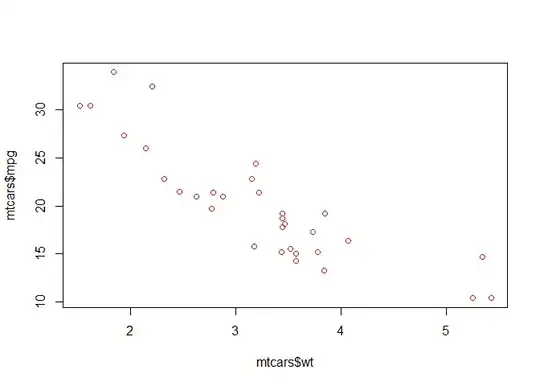
but
my_obj$Plot
Created on 2023-05-08 with reprex v2.0.2
Edit
It seems the OP is looking for a function that outputs a multiple plot page using cowplot but with the option of the user accessing individual plots. This could be done more easily, this time using a single print method:
library(ggplot2)

example <- function(x, y) {

  df <- data.frame(x, y)

  plot1 <- ggplot(df, aes(x, y)) + geom_point()
  plot2 <- ggplot(df, aes(x)) + geom_density()
  plot3 <- ggplot(df, aes(y)) + geom_density()
  plot4 <- ggplot(df, aes(sort(x), sort(y))) + geom_point() + geom_abline()

  structure(list(plot1, plot2, plot3, plot4), class = "multiplot")
}

print.multiplot <- function(x, ...) {
  print(cowplot::plot_grid(x[[1]], x[[2]], x[[3]], x[[4]]))
}
This allows:
example(x, y)

but allows individual plots to be accessed too:
example(x, y)[[1]]