Environment: R Console RMySQL ggplot2
I connected my mysql table and have this as an output
| Category | Dataset1 | Dataset2 |
|---|---|---|
| A | 30 | 60 |
| B | 70 | 40 |
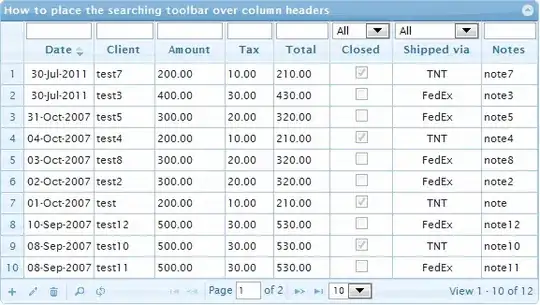
I am having difficulties trying to understand how I can get ggplot to output a grouped bar chart similar to
I tried following the instructions at https://r-graph-gallery.com/48-grouped-barplot-with-ggplot2 > Grouped barchart but I can't seem to wrap my head around how it's supposed to be configured.

