I recently switched a workstation from windows to linux, and for interactive use, the font sizes as chosen by geom_text are dramatically different. I'm trying to find a way to set the base size for geom_text so that the use of geom_text(aes(size=..)) can be used interchangeably between windows and linux with similar-enough results.
Notably, without changing the actual code that produces the plot.
Code:
R.version[c("system","version.string")]
# _
# system x86_64, mingw32
# version.string R version 4.2.3 (2023-03-15 ucrt)
plot(mpg ~ disp, mtcars, type="n")
with(mtcars, text(disp, mpg, cyl))
library(ggplot2)
packageVersion("ggplot2")
# [1] ‘3.4.2’
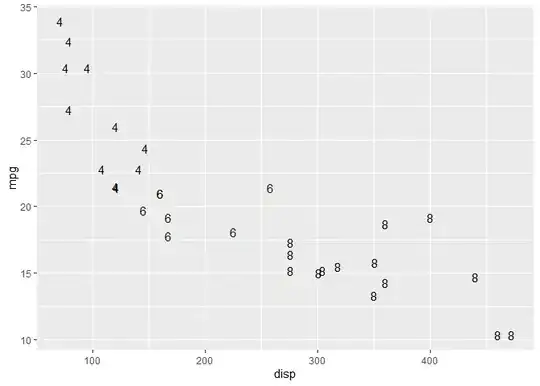
ggplot(mtcars, aes(disp, mpg, label = cyl)) + geom_text()


The font size for base text and ggplot2 geom_text are approximately the same.
Same code on Ubuntu 22.04:
R.version[c("system","version.string")]
# _
# system x86_64, linux-gnu
# version.string R version 4.2.3 (2023-03-15)
plot(mpg ~ disp, mtcars, type="n")
with(mtcars, text(disp, mpg, cyl))
library(ggplot2)
packageVersion("ggplot2")
# [1] ‘3.4.2’
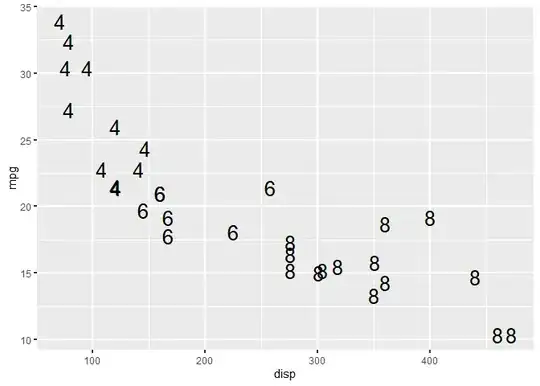
ggplot(mtcars, aes(disp, mpg, label = cyl)) + geom_text()


The text sizes are markedly different.
Since there is much legacy code that needs to run similarly (I recognize some differences will sneak through), I would like to be able to set something (perhaps in .Rprofile) that will render similar font sizes for both geom_text and axis labels and titles, etc.
- Something like
theme_set(theme_gray(base_size=20))does not affectgeom_textsizes. - This is not a symptom of "high DPI monitor", this has been tested on both high and low DPI displays (on the same linux system).
- Running
extrafont::loadfonts()(with fully-imported fonts) before loading ggplot2 does not fix it.
Is it possible to set geom_text size via theme? is very very similar: to be clear, if there is a way to set it to a known/common size basis, regardless of the ability to set it to arbitrary values, I'm good with that.