ggplot() +
    labs(x = "Bla")
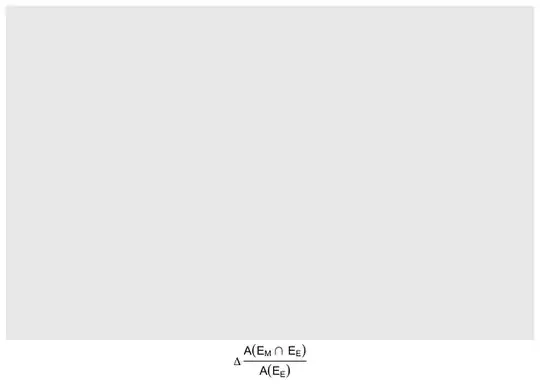
I want to change the "Bla" label from the previous code so that it displays this equation:

However, I don't know how to include the intersection operator. Any help would be appreciated, thanks.
ggplot() +
labs(x = "Bla")
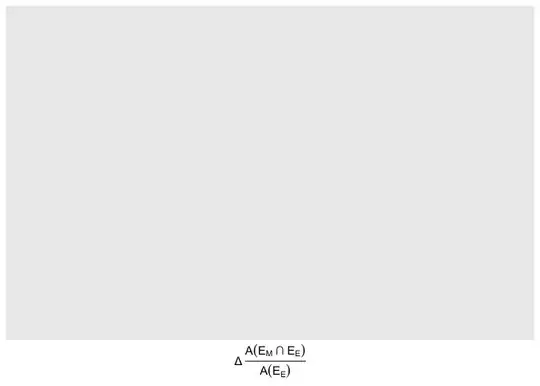
I want to change the "Bla" label from the previous code so that it displays this equation:
However, I don't know how to include the intersection operator. Any help would be appreciated, thanks.
Using ?plotmath you could add an intersection operator via intersect():
Note: Thx to @G.Grothendieck for teaching me that wrapping inside expression() is not needed.
library(ggplot2)

#xlab <- expression(Delta~frac(A(E[M]~intersect()~E[E]), A(E[E])))

xlab <- Delta~frac(A(E[M]~intersect()~E[E]), A(E[E]))

ggplot() +
  labs(x = xlab)
From what I understand, you should use the latex2exp package to write the legend directly in Latex, as follows:
library(latex2exp)
library(ggplot2)
ggplot() +
  labs(x = TeX(r'($\Delta \frac{A(E_M \cap E_E)}{A(E_E)}$)'))
You can use unicode for symbols. For example \u0394 for delta and \u2229 for intersection.
library(ggplot2)
ggplot() + xlab(expression("\u0394"~frac(A(E[M]~"\u2229"~E[E]), A(E[E]))))
Created on 2023-05-11 with reprex v2.0.2