library(ggplot2)

ggplot(mtcars, aes(cyl, mpg, fill = factor(cyl))) +
  geom_violin(alpha = 0.66, color = NA, position = position_dodge(1), width = 1) +
  geom_boxplot(color = "black", alpha = 0.9, width = 0.4, position = position_dodge(1)) +
  scale_fill_brewer(palette = "Pastel2") +
  theme_bw() +
  scale_y_continuous(breaks = c(10, 15, 20, 25, 30, 35)) +
  theme(legend.position = c(0.9, 0.9)) +
  theme(text = element_text(size = 12)) +
  labs(title = "Example", x = "Cyl", y = "MPG", fill = "CYL")
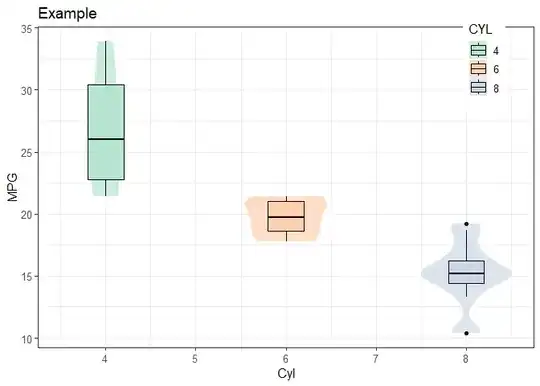
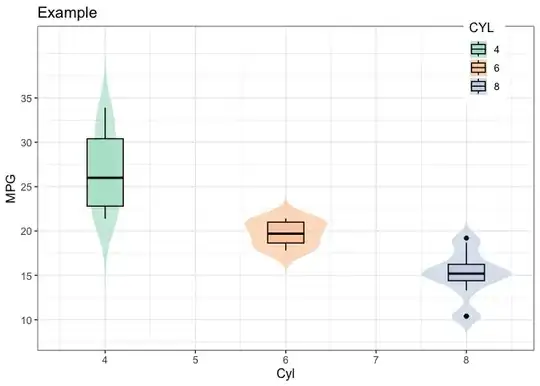
I don’t want the tip of my violin plot to be cut off. How can I make my plot similar to the plot shown below?