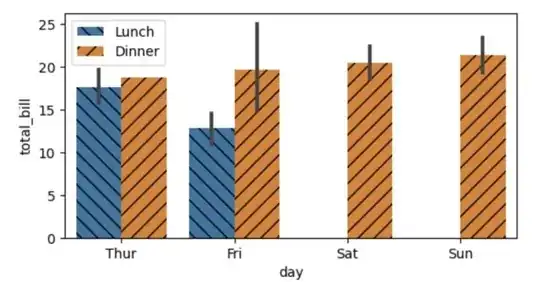
I created a bar plot with hatches using seaborn. I was also able to add a legend that included the hatch styles, as shown in the MWE below:
import matplotlib.pyplot as plt
import seaborn as sns

tips = sns.load_dataset("tips")

hatches = ['\\\\', '//']

fig, ax = plt.subplots(figsize=(6,3))
sns.barplot(data=tips, x="day", y="total_bill", hue="time")

# loop through days
for hues, hatch in zip(ax.containers, hatches):
    # set a different hatch for each time
    for hue in hues:
        hue.set_hatch(hatch)

# add legend with hatches
plt.legend().loc='best'

plt.show()
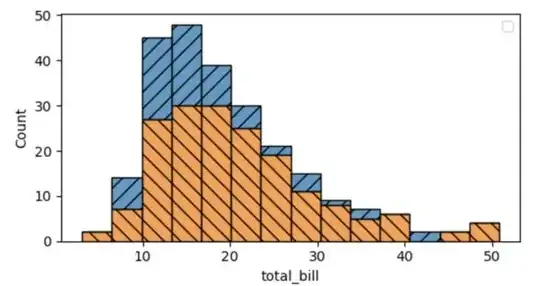
However, when I try to create a histogram on seaborn with a legend, the same code does not work; I get the following error: No artists with labels found to put in legend. Note that artists whose label start with an underscore are ignored when legend() is called with no argument.
I've looked for an answer online, but I haven't been successful at finding one.
How can I add the hatches to the legend of a histogram for the MWE below?
import matplotlib.pyplot as plt
import seaborn as sns

tips = sns.load_dataset("tips")

hatches = ['\\\\', '//']

fig, ax = plt.subplots(figsize=(6,3))
sns.histplot(data=tips, x="total_bill", hue="time", multiple='stack')

# loop through days
for hues, hatch in zip(ax.containers, hatches):
    # set a different hatch for each time
    for hue in hues:
        hue.set_hatch(hatch)

# add legend with hatches
plt.legend().loc='best' # this does not work

plt.show()


