4

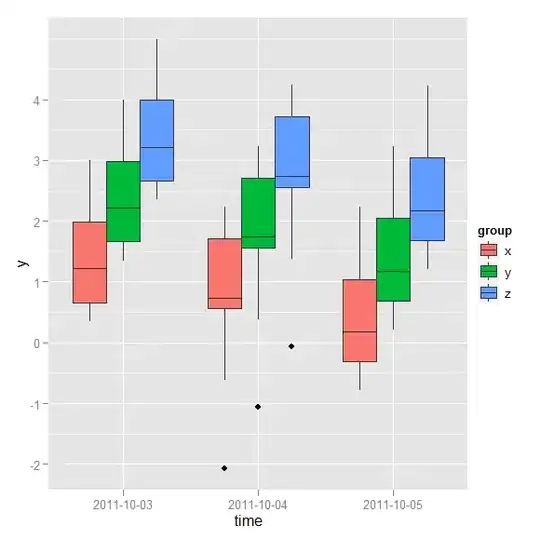
I have an experiment where three evolving populations of yeast have been studied over time. At discrete time points, we measured their growth, which is the response variable. I basically want to plot the growth of yeast as a time series, using boxplots to summarise the measurements taken at each point, and plotting each of the three populations separately. Basically, something that looks like this (as a newbie, I don't get to post actual images, so x,y,z refer to the three replicates):

|              xyz
|       x z    xyz
|  y    xyz
| xyz    y
| x z     
|
-----------------------
  t0     t1    t2

How can this be done using ggplot2? I have a feeling that there must be a simple and elegant solution, but I can't find it.

Triad sou.
  • 2,969
  • 3
  • 23
  • 27
SlowLearner
  • 131
  • 1
  • 10
  • 1
    please add some sample data by posting the results of `dput(yourDataHere)`. Other great tips found here: http://stackoverflow.com/questions/5963269/how-to-make-a-great-r-reproducible-example – Chase Oct 02 '11 at 13:27

1 Answers1

5

Try this code:

require(ggplot2)

df <- data.frame(
  time = rep(seq(Sys.Date(), len = 3, by = "1 day"), 10),
  y = rep(1:3, 10, each = 3) + rnorm(30),
  group = rep(c("x", "y", "z"), 10, each = 3)
)
df$time <- factor(format(df$time, format = "%Y-%m-%d"))

p <- ggplot(df, aes(x = time, y = y, fill = group)) + geom_boxplot()
print(p)

Fig1

Only with x = factor(time), ggplot(df, aes(x = factor(time), y = y, fill = group)) + geom_boxplot() + scale_x_date(), was not working.

Pre-processing, factor(format(df$time, format = "%Y-%m-%d")), was required for this form of graphics.

Triad sou.
  • 2,969
  • 3
  • 23
  • 27
  • This works! Just needs to make sure that the factors are [correctly ordered](http://www.cookbook-r.com/Manipulating_data/Changing_the_order_of_levels_of_a_factor/) for most applications – SlowLearner Oct 02 '13 at 09:39