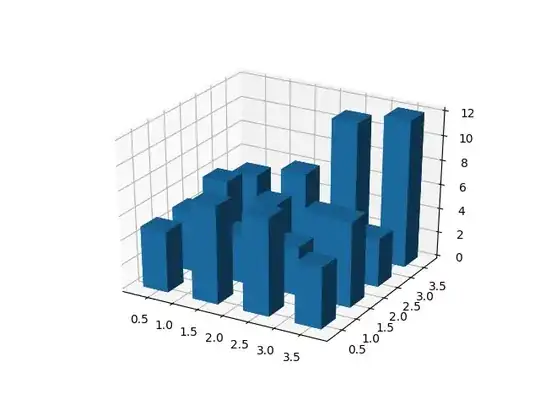
I am looking for a way to plot multiple histograms of 2D data, but I could not find any documentation about addressing such a problem.
Plotting multiple 1-dimensional histograms on a same chart with Matplotlib has been addressed in this thread and it also covered in the Matplotlib docs.

There are threads and documentations that deal with 2D data (3d plots or contours), but for a single data series.


I could not find any thread/docs on plotting multiple 2D-data histograms on the same chart. Is there a way to do it?
