I have created a barplot with hatches with the code below:
import matplotlib.pyplot as plt
import seaborn as sns

tips = sns.load_dataset("tips")

hatches = ['\\\\', '//']

fig, ax = plt.subplots(figsize=(6,3))
sns.barplot(data=tips, x="day", y="total_bill", hue="time")

# loop through days
for hues, hatch in zip(ax.containers, hatches):
    # set a different hatch for each time
    for hue in hues:
        hue.set_hatch(hatch)

# add legend with texture
plt.legend()

plt.show()
And it outputs the following plot:
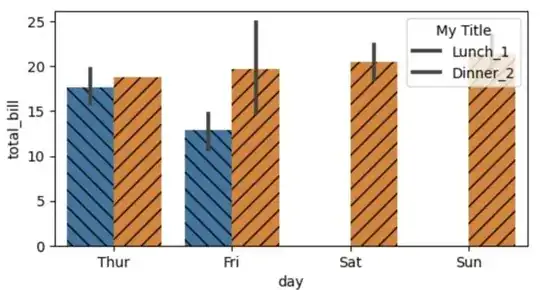
If I try to modify the legend to (a) add a title and (b) change the hue labels, the code breaks down, and I lose the color and hatches from the legend:
import matplotlib.pyplot as plt
import seaborn as sns

tips = sns.load_dataset("tips")

hatches = ['\\\\', '//']

fig, ax = plt.subplots(figsize=(6,3))
sns.barplot(data=tips, x="day", y="total_bill", hue="time")

# loop through days
for hues, hatch in zip(ax.containers, hatches):
    # set a different hatch for each time
    for hue in hues:
        hue.set_hatch(hatch)

# add legend with texture
plt.legend(title='My Title', labels=['Lunch_1','Dinner_2'], loc=1)

plt.show()
So my questions is: How do I add a title and modify the labels without losing the color and hatches from the legend?


