I have some problems with making a stacked bar chart in ggplot2.Here is my data look like:
   ID  Genus                          name    value
 1 JP  Dermatophagoides               GroupA  0.997
 2 JP  Dermatophagoides               GroupB  NA
 3 JP  Dermatophagoides evansi        GroupA  0.00259
 4 JP  Dermatophagoides evansi        GroupB  NA
 5 AM  Dermatophagoides farinae       GroupA  0.302
 6 AM  Dermatophagoides farinae       GroupB  0.303
 7 AM  Dermatopha microceras          GroupA  0.650
 8 AM  Dermatopha microceras          GroupB  0.653
 9 AM  N/A                            GroupA  0.00915
10 AM  N/A                            GroupB  0.00642
11 AS  Cohorte Bimichaeliina          GroupA  0.795
12 AS  Cohorte Bimichaeliina          GroupB  0.796
13 AS  Nematalycoidea                 GroupA  0.0120
14 AS  Nematalycoidea                 GroupB  0.0123
15 AS  Possibly Cohorte Bimichaeliina GroupA  0.193
16 AS  Possibly Cohorte Bimichaeliina GroupB  0.191
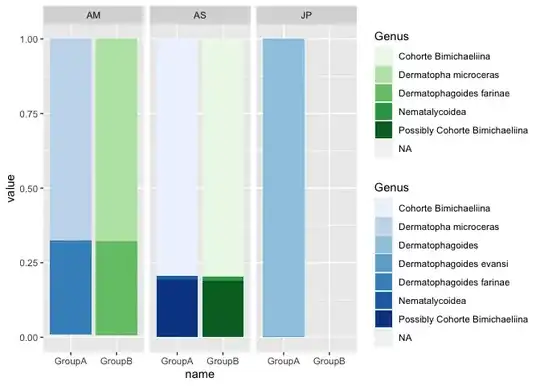
I am trying to visualize Genus,name and value based on every ID.I also tried the code at this page Showing data values on stacked bar chart in ggplot2, like I have tried :
df1 <- df %>% select(ID == "JP")
ggplot(dt1, aes(name, value, fill = Genus)) +
  geom_col()
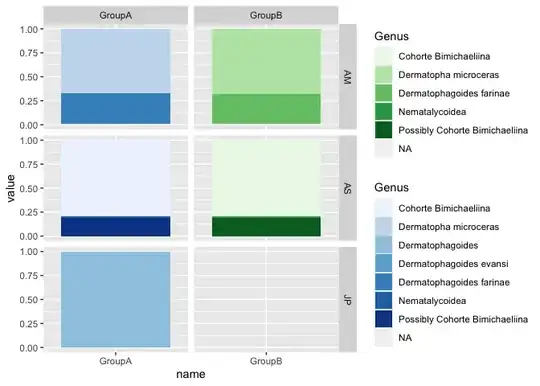
Desired format of plots like

But I only can handle one ID each time.I have multiple IDs,also want colored by name, for example GroupA using blue(dark to light) and GroupB using another Green(dark to light).Any help in this regard will be highly appreciated. Thanks.