The simlified issue is as follows:
library(dplyr)
library(ggplot2)

data.frame(x=c(1,10,100,1000,10000), nms = c("A","B","C","D","E")) %>%
  ggplot(aes(x=x, y=nms)) +
  geom_bar(stat = "identity") +
  geom_text(aes(label = x),
            vjust = 0.5, hjust = -0.1, color = "gray")

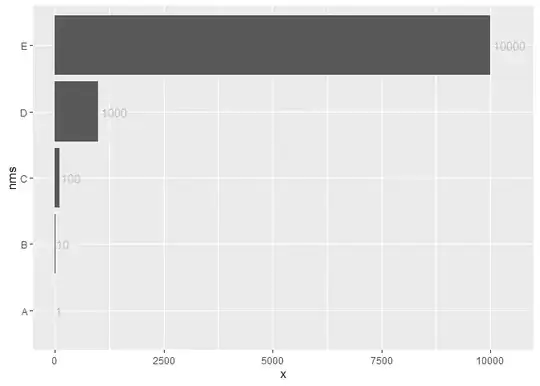
As it is seen here the digits of the geom_text are not displayed for certain values. I manually set the limits for the x axis for instance by adding + scale_x_continuous(limits=c(0,11000)). But it seems not a good practice as the value of the upper limit is set randomly. Scaling up the upper limit by for example 10% max(x)*1.1 is not a solution asd well as 10% is a random number especially if it is expected that log trans can be added (or not added) to the x scale depending upon the specific values for different datasets used for the same visualisation and thus it does not take into account the width of the printed text label.
So my question is: what is the proper solution to add these geom_text geoms?