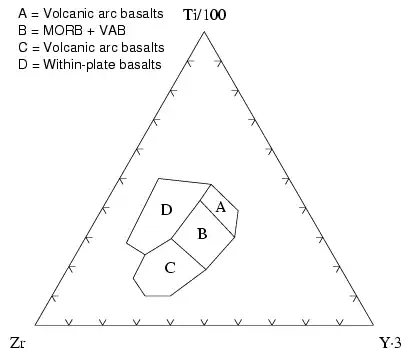
How can we create a barplot similar to the one in the image using R and ggplot2? Any walkthrough will be greatly helpful.
Asked
Active
Viewed 17 times
0
-
1Welcome to Stackoverflow. Please help others to help you: What have you tried? What are the coding problems you are experiencing? What is your expected output? Please make your question reproducible [MRE]: include a sample of your data into the question using `dput(your_dataframe)` [Helpful guidance for asking questions](https://stackoverflow.com/questions/5963269/how-to-make-a-great-r-reproducible-example) – Peter May 28 '23 at 12:37
-
2Stack Overflow isn't really the place for walkthroughs or tutorials I'm afraid. It's for _specific_ programming questions. If you have a data set and have tried to create a stacked bar plot, then by all means post the data and show us where you got stuck. At the moment your question is off-topic. – Allan Cameron May 28 '23 at 12:56
