This answer shows how to create the final plot that you asked for. Both requests (single color and connected line) are very possible. A Google search of your desired plot image shows that it was originally an animation, which is something else that I have included.
Answer
Use ax.plot(...) instead of ax.scatter(...) in order to connect the points with a line. Then you can add a few other features to make the output look more like your end goal.
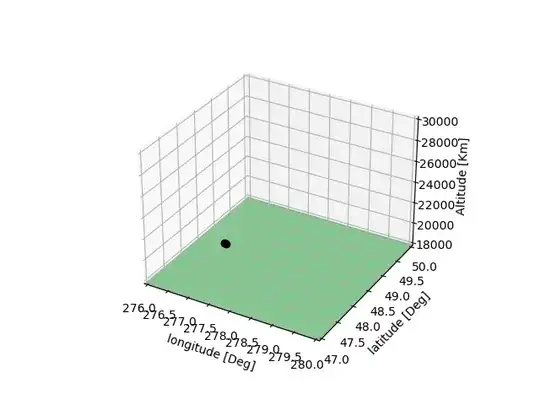
Example Output
Here is a figure showing your end goal. The code to reproduce the figure is added below.
It is also possible to create an animation of the plot over time. Note that the color of the lines changes as the distance from the start position increases. This feature is easily disabled.
Code
This is some setup code to be used for both static and animated figures.
# necessary imports
import numpy as np
import matplotlib.pyplot as plt
import mpl_toolkits.mplot3d.art3d as art3d
from matplotlib.animation import FuncAnimation
from matplotlib.patches import Circle

# creating dummy data for two objects
lon = np.sort(277.0 + np.random.rand(2,100)*2)
lat = np.sort(48 + np.random.rand(2,100))
Z  = np.sort(20000 + np.random.rand(2,100)*8000)
lat[1] -= 2*(-lat[1][0] + lat[1]) # moving the lines in different directions
This is for the static version of the figure.
# creating the main figure and setting boundaries (change these as needed)
fig = plt.figure(6)
ax = fig.add_subplot(111, projection='3d')
ax.set_xlim(276, 280)
ax.set_ylim(46, 50)
ax.set_zlim(np.min(Z), 30000)

ax.set_xlabel('longitude [Deg]')
ax.set_ylabel('latitude [Deg]')
ax.set_zlabel('Altitude [Km]')
ax.zaxis.set_pane_color((0.36, 0.7, 0.42, 0.75)) # making the 'ground' green

# plotting data from object 1
# line plot for the path of the object
line = ax.plot(lon[0],lat[0],Z[0], c='k')
# plotting a vertical line from the ground to the final position of the object
vertLine = ax.plot([lon[0][-1],lon[0][-1]],[lat[0][-1],lat[0][-1]],[np.min(Z),Z[0][-1]], c='k')
# plotting a dot at the final postion of the object
dot = ax.plot(lon[0][-1], lat[0][-1], Z[0][-1], linestyle="", marker="o", c='k')

# plotting data from object 2 (see above for details)
line1 = ax.plot(lon[1],lat[1],Z[1], c='r', alpha=1)
vertLine1 = ax.plot([lon[1][-1],lon[1][-1]],[lat[1][-1],lat[1][-1]],[np.min(Z),Z[1][-1]], c='r', alpha=1)
dot1 = ax.plot(lon[1][-1], lat[1][-1], Z[1][-1], linestyle="", marker="o", c='r', alpha=1)

# adding green reference circle to the 'ground'
p = Circle((278,48.5),1, alpha=0.75, edgecolor=(0.3, 0.6, 0.39, 0.75), fill=False)
ax.add_patch(p)
art3d.pathpatch_2d_to_3d(p, z=np.min(Z), zdir="z")
ax.text(278,48.5,np.min(Z),"x", color=(0.3, 0.6, 0.39, 0.75))

# creating a new subplot for top down view
ax2 = fig.add_subplot(331)
ax2.set_xlim(276, 280)
ax2.set_ylim(46, 50)
ax2.set_aspect('equal')

# adding reference circle and background color
ax2.set_facecolor((0.36, 0.7, 0.42, 0.75))
p2 = Circle((278,48.5),1, alpha=0.75, facecolor=(0.3, 0.6, 0.39, 0.75))
ax2.add_patch(p2)

# plotting path lines and final position dots
ax2.plot(lon[0],lat[0], c='k')
ax2.plot(lon[1],lat[1], c='r')
ax2.scatter(lon[0][-1], lat[0][-1], c='k',s=20)
ax2.scatter(lon[1][-1], lat[1][-1], c='r',s=20)

# Show the plot!
plt.show()
This is the code to create an animated version of the plot over time.
# create figure/axis with appropriate params
fig = plt.figure(6)
ax = fig.add_subplot(111, projection='3d')
ax.set_xlim(276, 280)
ax.set_ylim(47, 50)
ax.set_zlim(18000, 30000)

ax.set_xlabel('longitude [Deg]')
ax.set_ylabel('latitude [Deg]')
ax.set_zlabel('Altitude [Km]')
ax.zaxis.set_pane_color((0.36, 0.7, 0.42, 0.75))

# create all components of the first object
line, = ax.plot(lon[0][:2],lat[0][:2],Z[0][:2], c='k', alpha=1)
vertLine, = ax.plot([lon[0][1],lon[0][1]],[lat[0][1],lat[0][1]],[np.min(Z[0]),Z[0][1]], c='k', alpha=1)
dot, = ax.plot(lon[0][1], lat[0][1], Z[0][1], linestyle="", marker="o", c='k', alpha=1)

# create all components of the second object
line1, = ax.plot(lon[1][:2],lat[1][:2],Z[1][:2], c='r', alpha=1)
vertLine1, = ax.plot([lon[1][1],lon[1][1]],[lat[1][1],lat[1][1]],[np.min(Z[1]),Z[1][1]], c='r', alpha=1)
dot1, = ax.plot(lon[1][1], lat[1][1], Z[1][1], linestyle="", marker="o", c='r', alpha=1)

def animate(i, colUpdate, numFrs): # colUpdate (bool), numFrs (int)
    # update the data for the path lines
    line.set_data(lon[0][:(i+1)*2],lat[0][:(i+1)*2])
    line.set_3d_properties(Z[0][:(i+1)*2])
    line1.set_data(lon[1][:(i+1)*2],lat[1][:(i+1)*2])
    line1.set_3d_properties(Z[1][:(i+1)*2])

    # update the data for the vertical lines
    vertLine.set_data(np.array([lon[0][((i+1)*2)-1],lon[0][((i+1)*2)-1]]),np.array([lat[0][((i+1)*2)-1],lat[0][((i+1)*2)-1]]))
    vertLine.set_3d_properties([np.min(Z[0]),Z[0][((i+1)*2)-1]])
    vertLine1.set_data(np.array([lon[1][((i+1)*2)-1],lon[1][((i+1)*2)-1]]),np.array([lat[1][((i+1)*2)-1],lat[1][((i+1)*2)-1]]))
    vertLine1.set_3d_properties([np.min(Z[1]),Z[1][((i+1)*2)-1]])

    # update the data for the endpoint dots
    dot.set_data(lon[0][((i+1)*2)-1],lat[0][((i+1)*2)-1])
    dot.set_3d_properties(Z[0][((i+1)*2)-1])
    dot1.set_data(lon[1][((i+1)*2)-1],lat[1][((i+1)*2)-1])
    dot1.set_3d_properties(Z[1][((i+1)*2)-1])

    # update the colors, if necessary
    if colUpdate:
        co = np.array([(i/numFrs),0.0,0.0])
        co1 = np.array([0.0,0.0,(i/numFrs)])

        line.set_color(co)
        vertLine.set_color(co)
        dot.set_color(co)

        line1.set_color(co1)
        vertLine1.set_color(co1)
        dot1.set_color(co1)
    # return all updated objects
    return line, vertLine, dot, line1, vertLine1, dot1,

# set params and create the animation artist
updateCol = True
numFrames = int(len(Z[0]) /2)
anim = FuncAnimation(fig, animate, frames = numFrames,interval = 100, fargs=(updateCol,numFrames,), blit=False, repeat=False)

# Show the plot!
plt.show()
Edit
In order to fix the animation portion of the code to be compatible with Matplotlib 3.5.1, you must change the following section of code in the animate(...) function. Replace the following:
    # update the data for the endpoint dots
    dot.set_data(lon[0][((i+1)*2)-1],lat[0][((i+1)*2)-1])
    dot.set_3d_properties(Z[0][((i+1)*2)-1])
    dot1.set_data(lon[1][((i+1)*2)-1],lat[1][((i+1)*2)-1])
    dot1.set_3d_properties(Z[1][((i+1)*2)-1])
With:
    # update the data for the endpoint dots
    dot.set_data(lon[0][((i+1)*2)-1],lat[0][((i+1)*2)-1])
    dot.set_3d_properties([Z[0][((i+1)*2)-1]])
    dot1.set_data(lon[1][((i+1)*2)-1],lat[1][((i+1)*2)-1])
    dot1.set_3d_properties([Z[1][((i+1)*2)-1]])
All this does is change the input for the set_3d_properties(...) to list format, which is the new standard in Matplotlib 3.5.1. See this open issue for a description of the problem.
Does this help?


