0

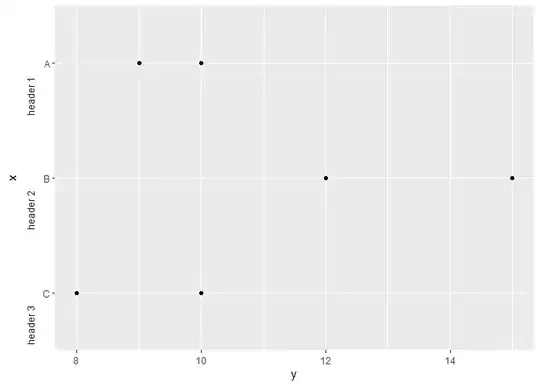
G'day, I have a bunch of data which can be grouped. I want to display those data in a plot. Nothing special so far. But i have stumbled over the problem of displaying the data in a way, that signals their grouping. What i want is header for each section at the x-axis: so for Example the string "header 1" at the beginnen of the axis, "header 2" between A and B and so on. Here's the code i got so far

# packages
library (ggplot2)

# data
df =  data.frame(
  x = factor(c("A", "B", "C", "B", "A", "C")), 
  y = c(10, 15, 8, 12, 9, 10)  
)

# Base plot
p <- ggplot(df, aes(x,y)) + geom_point() + 
  coord_flip()

p

enter image description here

There already exists a thread on a similar topic. Yet i would prefer a more "ggplot-y" way of doing so. Plus i would want the headers to be located directly at the x- axis.

Any help would be awesome, thanks

Lenman55
  • 27
  • 4
  • I don't think there is a ggploty way of doing this. I've been working on something like this in a ggplot2 extension, but isn't in a useable state at the moment. – teunbrand Jun 02 '23 at 10:01
  • Thank you for your answer. If i may ask, how would you proceed in my case? – Lenman55 Jun 02 '23 at 10:04
  • 2
    I'd probably use facets with zero panel spacing to imitate the outcome, using the strip label as the header. – teunbrand Jun 02 '23 at 10:33

2 Answers2

1

something like this?

library (ggplot2)
library(dplyr)

df <- data.frame(
    x = gl(4, 1, labels = c('first', 'A', 'second', 'B')),
    y = rnorm(4),
    show_marker = c(FALSE, TRUE)
)

df |>
    ggplot(aes(x,y)) + 
    geom_point(data = df |> filter(show_marker)) +
    scale_x_discrete(drop = FALSE,  ) +
    coord_flip() +
    theme(axis.text.y = element_text(angle = c(90, 0),
                                     hjust = c(0)
                                     )
          )

unused factor levels as section marks

I_O
  • 4,983
  • 2
  • 2
  • 15
1

We could do it with facets:

# data
df =  
  data.frame(
  x = factor(c("A", "B", "C", "B", "A", "C")), 
  label = factor(c("header 1", "header 2", "header 3", "header 2","header 1", "header 3")), 
  y = c(10, 15, 8, 12, 9, 10)  
)

  ggplot(df, aes(x,y)) +
  geom_point() + 
  coord_flip() + 
  facet_wrap(~ label,ncol = 1,strip.position = "left", scales = "free_y") +
  theme(panel.spacing = unit(0,'cm'),
        strip.placement = "outside",
        strip.background = element_blank(),
        strip.text = element_text(hjust = 0))

Created on 2023-06-02 with reprex v2.0.2

M Aurélio
  • 830
  • 5
  • 13