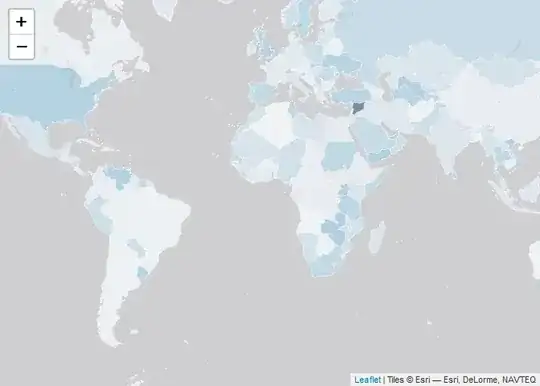
For some reason, despite the fact Syria in the dataframe has Value = 1, when I plot the map it shows up as 0.038 and is called Belarus... and all the other countries also get some crazy values and other country names... I don't understand why it happens. Here is the code...
#libraries
library(tidyverse)
library(leaflet)
library(rnaturalearth)
library(rnaturalearthdata)
library(sf)
library(countrycode)

#load world data from natural earth
world <- ne_countries(scale = "large", returnclass = "sf")
world <- st_transform(world, "+proj=longlat +datum=WGS84")

countrynames <- countryname_dict %>%
  group_by(country.name.en) %>%
  summarise(country.name.en) %>%
  distinct()

countrynames <- dplyr::pull(countrynames, country.name.en)

# These values are random just to test out mapping. I wanted for each country to have a color based on the ratio between 0 and 1 with some random numbers. All of them ARE indeed between 0 and 1 in the data frame
world_values <- c(1:284)
df <- cbind (countrynames, world_values)
df <- as.data.frame(df)
df$world_values <- as.numeric(df$world_values)
df$world_values[241] <- 599
df <- df %>%
  mutate(Value = world_values / 599)

# Match country codes in world data with countrynames
df$iso_a3 <- countrycode(sourcevar = countrynames, origin = "country.name", destination = "iso3c")
df <- df %>% na.omit()

map <- leaflet() %>%
  addProviderTiles("Esri.WorldGrayCanvas") %>%
  setView(lng = 0, lat = 0, zoom = 2)

palette <- colorNumeric(
  palette = "Blues",
  domain = c(0,1)
)

# Add country polygons layer
map <- map %>%
  addPolygons(
    data = world,
    stroke = TRUE,
    fillColor = ~palette(df$Value),
    fillOpacity = 0.5,
    popup = ~paste("Country:", df$countrynames, "<br>", "Value:", df$Value),
    color = "white",
    weight = 1,
    layerId = ~iso_a3,
    label = NULL
  )

# Print the map
map
I have tried changing layerId, fillColor, palette and popup to other things. I'm at wits' end.