1

I managed to plot the means as a line, however, I do not know how to plot their respective standard deviation as geom_smooth.

When I just use the geom_smooth function, it does not seem to plot the correct standard deviation.

This is my code so far:

library("ggplot2")

df <- data.frame(wue_r$WUE19, wue_r$WUE27, wue_r$WUE16, wue_r$WUE17)

mean <- rowMeans(df)

wue_fin<-cbind(wue_r, means = mean)

colors <- c("WUE16"="chartreuse", "WUE19"="chartreuse3",  "WUE27"="darkgreen", "WUE17"="darkolivegreen", "means"="black")

plot1 <- ggplot(wue_fin, aes(x=Year)) +  
  geom_line(aes(y=WUE16, color="WUE16"), linewidth=1.75) + 
  geom_line(aes(y=WUE19, color="WUE19"), linewidth=1.75) + 
  geom_line(aes(y=WUE27, color="WUE27"), linewidth=1.75) + 
  geom_line(aes(y=WUE17, color="WUE17"), linewidth=1.75) + 
  geom_smooth(aes(y=means, color="means"), span=0.2, fill="grey", linetype="twodash", linewidth=2) + 
  labs(color="Legend") + 
  scale_color_manual(values=colors)`

Thanks in advance!
Axeman
  • 32,068
  • 8
  • 81
  • 94
rubst4r
  • 11
  • 2
  • 1
    If you give a [minimal reproducible example](https://stackoverflow.com/questions/5963269/how-to-make-a-great-r-reproducible-example) you are much more likely to receive a useful answer. – Axeman Jun 06 '23 at 19:22

1 Answers1

0

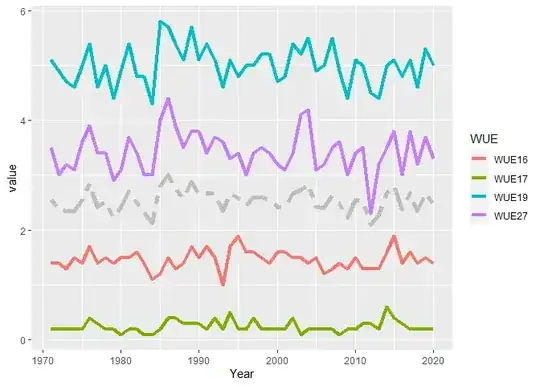
Here is a solution.
This type of problems generally has to do with reshaping the data. The format should be the long format and the data is in wide format. See this post on how to reshape the data from wide to long format.

library("ggplot2")

means_cols <- c("WUE19", "WUE27", "WUE16", "WUE17")
means <- rowMeans(wue_r[means_cols])
wue_fin <- cbind(wue_r, means)

wue_fin |>
  tidyr::pivot_longer(-c(Year, means), names_to = "WUE") |> 
  ggplot(aes(Year, value)) +
  geom_line(aes(color = WUE), linewidth = 1.5) +
  geom_line(aes(y = means), color = "grey", linetype = "twodash", linewidth = 2)

Created on 2023-06-06 with reprex v2.0.2


Test data

The test data is built-in data set iris, transformed.

wue_r <- iris[1:50, -5]
names(wue_r) <- c("WUE19", "WUE27", "WUE16", "WUE17")
wue_r$Year <- 1970 + 1:50

Created on 2023-06-06 with reprex v2.0.2

Rui Barradas
  • 70,273
  • 8
  • 34
  • 66