0

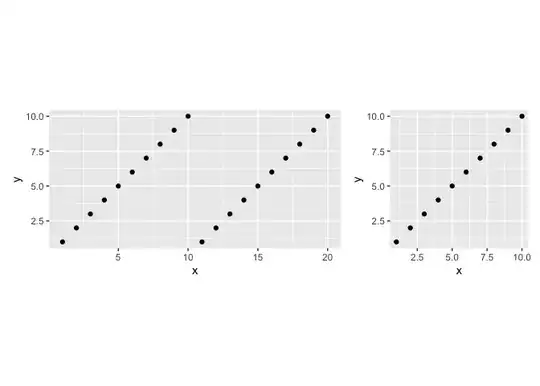
Building on this question, I am trying to do the exact same, but horizontally instead of vertically.

The solution accepted in the question doesn't seem to work when the alignment is vertical.

Can anyone explain why? And how to fix it?

Here's an example unsing egg, as suggested in the answer to the original question.

dat1 <- data.frame(y = rep(1:10, 2), x = 1:20)
dat2 <- data.frame(x = 1:10, y = 1:10)
plot1 <- ggplot(dat1, aes(x = x, y = y)) + geom_point() + coord_equal()
plot2 <- ggplot(dat2, aes(x = x, y = y)) + geom_point() + coord_equal()
egg::ggarrange(plot1, plot2, nrow = 1)

Output: enter image description here

Notice that the plot on the left lost its coord_equal in favour of the two plots having the same width.

ltr
  • 332
  • 2
  • 9
  • Could you not specify the width of the plots, e.g. `egg::ggarrange(plot1, plot2, nrow = 1, widths = c(2, 1))`? Even make it reflect the data, e.g. `egg::ggarrange(plot1, plot2, nrow = 1, widths = c(max(dat1$x),max(dat2$x)))` – Tech Commodities Jun 08 '23 at 10:50

1 Answers1

0

One option is to use the patchwork package.

library(ggplot2)
library(patchwork)

dat1 <- data.frame(y = rep(1:10, 2), x = 1:20)
dat2 <- data.frame(x = 1:10, y = 1:10)
plot1 <- ggplot(dat1, aes(x = x, y = y)) + geom_point() + coord_equal()
plot2 <- ggplot(dat2, aes(x = x, y = y)) + geom_point() + coord_equal()

Use + to put plots side-by-side.

plot1 + plot2

Created on 2023-06-08 with reprex v2.0.2

benson23
  • 16,369
  • 9
  • 19
  • 38
  • So elegant, thank you. Still puzzled by the different behaviour of the vertical and horizontal alignments. – ltr Jun 08 '23 at 02:38