1

When using ggbreak together with ggplot2, the axis labels are shifted. When plotting the graph without inserting a break, the x-axis label is centered on the axis and the y-axis label is close to the y-axis. After introducing the break, the x-axis label shifts to the right, such that it is positioned in the middle of the whole graph including the legend. The y-axis label is moved away from the axis. Both seem to be caused by an introduction of a frame around the whole graph, which can be made invisible, but whose effec remains.

See the following MWE

library(ggplot2)
library(ggbreak)

theme_set(theme_light())

plot <- ggplot(iris, aes(x=Sepal.Length, y=Sepal.Width, color=Species)) +
  geom_point()
plot #without using ggbreak

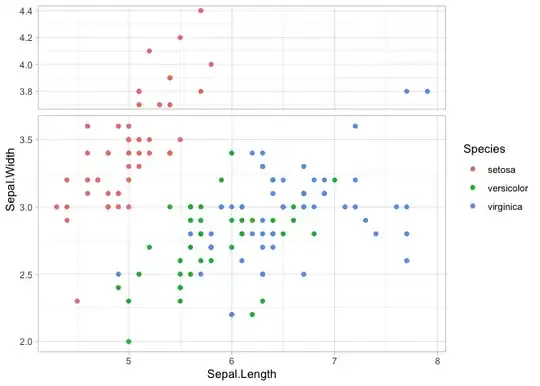
plot_withbreak <- ggplot(iris, aes(x=Sepal.Length, y=Sepal.Width, color=Species))+
  geom_point()+
  scale_y_break(c(3.5, 3.7))
plot_withbreak #with ggbreak

plot_withbreak + theme_update(
  panel.border = element_blank()
) #removes additional frame, but problem persists.
Till
  • 11
  • 1

2 Answers2

1

We can organize it by hand:

library(ggplot2)
library(ggbreak)

theme_set(theme_light())

ggplot(iris, aes(x=Sepal.Length, y=Sepal.Width, color=Species)) +
  geom_point()


ggplot(iris, aes(x=Sepal.Length, y=Sepal.Width, color=Species))+
  geom_point()+
  scale_y_break(c(3.5, 3.7)) +
  theme(plot.margin = margin(5.5, 5.5, 5.5, 5.5, "mm"),legend.position = "top") 

enter image description here

TarJae
  • 72,363
  • 6
  • 19
  • 66
  • Thank you! While this solution unfortunately doesn't solve the core of the problem (the introduction of the additional frame) either, the reference to plot margins was very helpful. I ended up with an acceptable plot with a try-and-error combination of plot.margin, vjust and panel.border = element_blank(). – Till Jun 15 '23 at 20:59
1

Not a real fix for the ggbreak issue. But a workaround to achieve your desired result would be to use vanilla ggplot2 and facet_grid:

library(ggplot2)

p <- ggplot(iris, aes(x=Sepal.Length, y=Sepal.Width, color=Species))+
  geom_point()+
  theme_light()

p +
  facet_grid(Sepal.Width < 3.7~., scales = "free_y", space = "free_y") +
  theme(strip.text.y = element_blank())

stefan
  • 90,330
  • 6
  • 25
  • 51
  • Thank you! This seems like an elegant solution. However, my MWE was not well chosen. In my original problem, I needed to plot data of different orders of magnitude in a bar chart, and only remove one middle part of one bar. Therefore, a break was indeed necessary in my case. – Till Jun 15 '23 at 20:46