The whole query is made up of 2 different parts WVDConnection, Perf processor and Perf memory. They're able to run individually but its unable to run as a whole. The error I've got "No results found from the last 24 hours Try selecting another time range". I've changed the time range to 30 min and the output is the same. The query is run on log analytics workspace. An example of the output (Username, CPUUtilization and MemoryUtilization) Am I missing something?
The queries and output are as the following: enter image description here
//list all users in a hostpool
WVDConnections
| where _ResourceId =~ 'resource id of hostpool'
//CPU and memory utilization
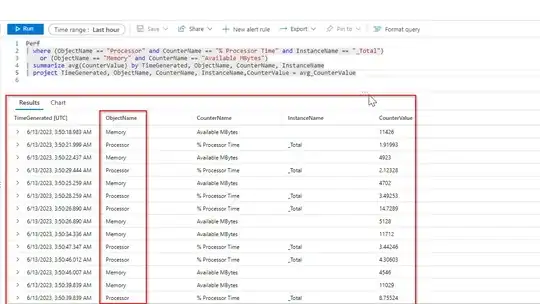
Perf
| where ObjectName == "Processor" and CounterName == "% Processor Time" and InstanceName == "_Total"
| summarize CPUUtilization = avg(CounterValue) by TimeGenerated
) on TimeGenerated
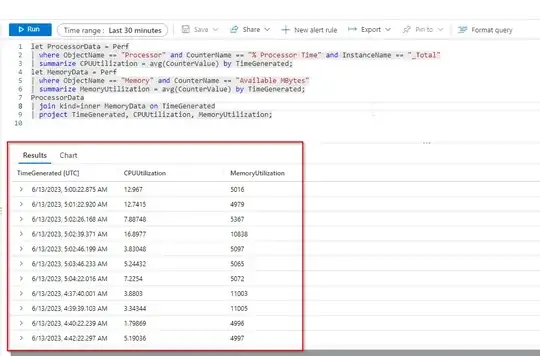
| join kind=inner (
Perf
| where ObjectName == "Memory" and CounterName == "Available MBytes"
| summarize MemoryUtilization = avg(CounterValue) by TimeGenerated
) on TimeGenerated
| project TimeGenerated, CPUUtilization, MemoryUtilization
//The whole query after joining both altogether
WVDConnections
| where _ResourceId =~ 'resource id of hostpool'
| project CorrelationId, State, TimeGenerated, UserName
| summarize TimeGenerated=min(TimeGenerated) by CorrelationId, State, UserName
| join kind=inner (
Perf
| where ObjectName == "Processor" and CounterName == "% Processor Time" and InstanceName == "_Total"
| summarize CPUUtilization = avg(CounterValue) by TimeGenerated
) on TimeGenerated
| join kind=inner (
Perf
| where ObjectName == "Memory" and CounterName == "Available MBytes"
| summarize MemoryUtilization = avg(CounterValue) by TimeGenerated
) on TimeGenerated
| project TimeGenerated, UserName, CPUUtilization, MemoryUtilization