I'm trying to run an analysis in R on a dataset with a variable number of columns. One part of the analysis is a linear regression, and to ensure the results make sense I would like to visualise the data from each column separately.
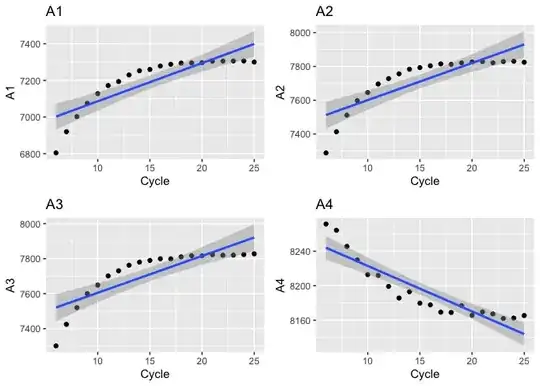
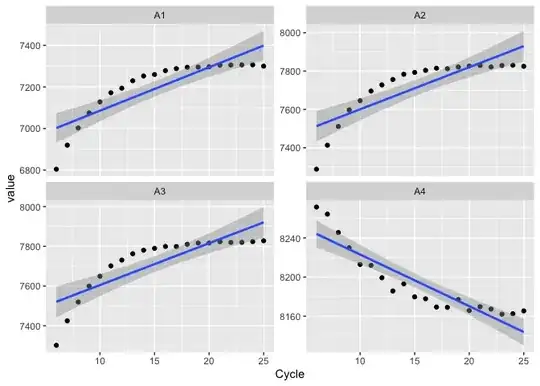
I've set up a loop for the analysis, and use ggsave to save each plot as a pdf - so far, all good, 72 distinct pdfs with individual plots. But if I want to create a list of plots, and use ggarrange to view them, all I get is a plot with 72 (assuming 72 columns of data!) copies of the last plot.
Code:
library(ggplot2)
library(dplyr)
library(ggpubr)
rm(list = ls())
#Select data (csv format, first column cycle numbers)
filename <- file.choose()
Data<-read.csv(filename)
#subtract first row from all data (requires dplyr)
Results<-data.frame(matrix(ncol=2,nrow=0, dimnames=list(NULL, c("Well", "Slope"))))
Data %>% mutate_if(is.numeric, funs(.-first(.)))
#subset based on cycles 6 to 25
Data<-Data[c(6:25),]
yy <-ncol(Data)
plotList=list()
for (i in seq(from = 2, to = yy, by = 1)){
well<-Data[,i]
lm_fit <- lm(well ~ Cycle, data=Data)
cf <- coef(lm_fit)
Slope <- cf[2]
WellData<-merge(i,Slope)
Results<-rbind(Results, WellData)
pltName <- paste( 'Plot', i, sep = '' )
P1 <-eval(substitute(ggplot(Data, aes(Cycle, well)) +
geom_point() + geom_smooth(method="lm")),list(i=i))
plotList[[i]]<-P1
filename<-(paste0(pltName,".pdf"))
ggsave(filename = filename)
}
colnames(Results) <- c("Well", "Slope")
Results[1]<-Results[1]-1
print(Results)
ggarrange(plotlist = plotList)
Example data:
Cycle   A1  A2  A3  A4
1   5451.07 5986.14 5922.59 7092.01
2   5953.04 6527.92 6505.93 7989.85
3   6227.3  6752.74 6783.56 8237.67
4   6477.02 6952.62 6959.91 8302.8
5   6660.14 7133.86 7149.98 8286.72
6   6804.14 7288.28 7301.48 8271.56
7   6919.78 7413.27 7424.77 8264.33
8   7002.38 7511.45 7519.84 8245.55
9   7075.04 7597.66 7599.81 8229.94
10  7127.82 7645.51 7649.2  8212.87
11  7171.94 7695.83 7701.47 8211.97
12  7193.82 7727.9  7730.65 8199.28
13  7229.76 7756.09 7762.58 8185.75
14  7252.7  7783.35 7780.36 8193.05
15  7259.97 7793    7789.77 8179.77
16  7278.49 7803.85 7799.26 8177.83
17  7288.07 7814.82 7799.02 8169.31
18  7294.38 7812.15 7810.12 8169.02
19  7295.29 7821.13 7816.68 8177.07
20  7296.58 7826.55 7816.37 8165.72
21  7304.65 7829.22 7823.11 8169.64
22  7305.38 7821.46 7819.89 8167.32
23  7306.26 7828.97 7820.36 8162.02
24  7306.38 7830.81 7823.79 8162.48
25  7300.14 7824.72 7827.94 8165.42
26  7296.08 7821.81 7816.32 8156.62
27  7301.82 7826.25 7816.6  8160.69
28  7295.56 7829.91 7822.93 8153.53
29  7295.81 7827.21 7809.87 8156.48
30  7299.35 7833.84 7821.41 8162.64
31  7300.85 7834.91 7819.91 8156.94