This sounded like a fun problem, so I gave it a go. This code is in javascript, both because I'm more familiar with it than ruby and because it can then be embedded on S.O., but the principles are the same and you should be able to translate it.
I did this in 3 parts.
1. The cosine formula
We want a cosine function with a given amplitude between the most likely numbers and the least likely numbers. You named this factor.
We also want that function to start and end at the minimum value and reach the maximum value a certain number of times. You named this intervals.
The function for this looks like:
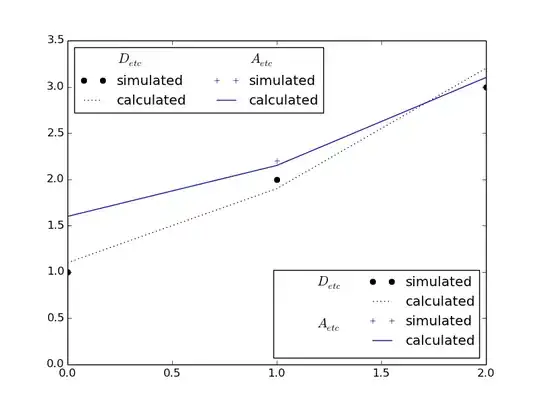
Where a represents intervals and b represents factor. In this example, I used your factor of 5 and intervals of 3 to produce this graph.

This function allows me to enter any x to get its relative probability.
That function translated to JS code looks like this:
const func = (x) => (1 + ((factor - 1)*(1 - Math.cos(2*Math.PI*intervals*x))/2))/(factor);
2. Precalculating Probability Weights.
Now that we have this function, we can determine how likely any number is to appear. Math.random() always returns a number between 0 and 1, and we want to map that value to the range of possible values. In the case of your example, that is 0-12, or 13 possible values.
The domain of our function we defined above is [0, 1], so we will divide that into 13 equal steps to calculate the probability of each number.
const stepLength = 1 / (definitionSteps-1);
//cosine function
const func = (x) => (1 + ((factor - 1)*(1 - Math.cos(2*Math.PI*intervals*x))/2))/(factor);

let weights = [];
for(let i = 0; i < definitionSteps; i++)
{
  weights.push(func(i * stepLength));
}
We will then cumulatively sum each weight so that each value in our weights array is equal to itself, plus the sum of all the preceding weights. This gives us a range of values for each index, but the scale is off. To fix this, we just divide each value in the array by the maximum value (or the last value).
3. Mapping the values.
Now that we have an array of weight ranges, we can simply call Math.random() to get a random number and map it to our possible values based on our weight ranges.
Say I have these weights:
[0.1, 0.3, 0.6, 1]
If I call Math.random() and get 0.4, that would map to index 2, since 0.4 is between 0.3 and 0.6. We do this same thing for our precalculated cosine weights.
The actual weight array for n=13, factor=5, intervals=3 looks like:
[0.025, 0.096, 0.223, 0.318, 0.350, 0.398, 0.513, 0.628, 0.676, 0.707, 0.902, 0.929, 1]
- So any number between 0 and 0.025 will be mapped to 0.
- Any number between 0.025 and 0.096 will be mapped to 1.
- and so on...
The last part of the code just calculates 10,000 random numbers, sorts them, and maps them to their respective indexes. I did it this way for performance to simulate 10,000 runs, but using the weights array, you can directly map any random number between [0, 1] to its corresponding weight.
The final output is printed to the console, and it looks very similar to your mockup graph in your question. In my case, I get:
[
  261,  //0
  783,  //1
  1387, //2
  810,  //3
  272,  //4
  801,  //5
  1375, //6
  833,  //7
  302,  //8
  800,  //9
  1309, //10
  795,  //11
  272   //12
]
const definitionSteps = 13;
const factor = 5;
const intervals = 3;
const count = 10000;

function calculateCosineWeights(factor, intervals)
{
  const stepLength = 1 / (definitionSteps-1);
  //cosine function
  const func = (x) => (1 + ((factor - 1)*(1 - Math.cos(2*Math.PI*intervals*x))/2))/(factor);

  let weights = [];
  for(let i = 0; i < definitionSteps; i++)
  {
    weights.push(func(i * stepLength));
  }

  weights.forEach((e, i) => {
    if(i > 0)
      weights[i] += weights[i - 1];
  });

  let max = weights[weights.length - 1];
  weights = weights.map(e => e / max);

  return weights;
}

let precalculatedWeights = calculateCosineWeights(factor, intervals);

function randcos(n)
{
  let vals = [];
  while(n > 0)
  {
    vals.push(Math.random());
    n--;
  }

  vals.sort((a, b) => a-b);

  let index = 0;
  let runningIndex = 0;
  let output = [];
  while(index < definitionSteps)
  {
    let x = 0;
    for(let i = runningIndex; i < vals.length && vals[i] < precalculatedWeights[index]; i++)
    {
      x++;
    }

    runningIndex += x;
    output.push(x);
    index++;
  }

  return output;
}

console.log(randcos(count));