3

I want to have error bars in my bar plots when more than 3 data points are available (Condition A) but omit error bars when there are less than 3 data points for that specific condition (Condition B).

I've only found options to show or hide error bars for all bars, not for specific conditions.

import pandas as pd
import seaborn as sns
import numpy as np

df = pd.DataFrame(np.random.randint(0,100,size=(15)), columns=["Value"])
df["Label"]="Condition A"
df.Label[13:]="Condition B"
sns.barplot(data=df, x="Label", y="Value", errorbar="sd")

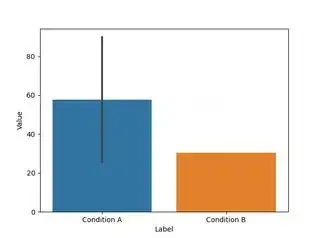
Actual Outcome: Error bars on all bars:

Actual outcome, error bars on all bars

Desired outcome: Error bars on condition A only:
Desired outcome, no error bar in condition B

mozway
  • 194,879
  • 13
  • 39
  • 75
fixnomal
  • 95
  • 1
  • 6

2 Answers2

5

You can use a custom errorbar function in sns.barplot. It should return a [y1, y2] iterable with the position of the min/max error:

# defining a custom function to only compute
# the error if more than 3 values
def cust_error(s):
    if len(s)<3:
        return [None, None]
    else:
        avg = s.mean()
        std = s.std()
        return [avg-std, avg+std]

sns.barplot(data=df, x="Label", y="Value", errorbar=cust_error)

Another option could be to plot the error bars manually:

ax = sns.barplot(data=df, x="Label", y="Value", errorbar=None)

g = df.groupby('Label', sort=False)
error = g['Value'].std().where(g.size()>=3)

plt.errorbar(range(len(s)), g['Value'].mean(), error,
             ls='', color='#5F5F5F', lw=3)

Output:

enter image description here

mozway
  • 194,879
  • 13
  • 39
  • 75
1

After finding this answer, I thought of a possible solution, looping through the ax.lines and setting the width to 0 for those that you do not want to show the line widths for. This requires show_errors to be in the same order as df.Label.unique().

NOTE: This assumes no other lines in the plot, so a simple barplot would be fine, but if there are any additional lines to the plot then this will return an error as the length of ax.lines will not be equal to show_errors.

df = pd.DataFrame(np.random.randint(0,100,size=(15)), columns=["Value"])
df["Label"]="Condition A"
df.Label[13:]="Condition B"
show_errors = [True, False]
ax = sns.barplot(data=df, x="Label", y="Value", errorbar="sd")
for p, err in zip(ax.lines, show_errors):
    if not err:
        p.set_linewidth(0)
plt.show()

As @mozway has shown in his answer, it could show_errors could be created through a condition: show_errors = df.groupby("Label", sort=False).Value.count().ge(3).tolist()

Rawson
  • 2,637
  • 1
  • 5
  • 14
  • Yes, I agree, I have updated the solution. Thank you – Rawson Jun 19 '23 at 18:46
  • You can also have other lines in your graph that are unrelated to the error bars. For instance if you already plotted something else on the Axes. You have to be really careful when removing objects from the graph. – mozway Jun 19 '23 at 18:46
  • Yes, that's true. I have assumed it was just a simple barplot as shown in the question. I should make that clear in the answer. Thanks – Rawson Jun 19 '23 at 18:47