Below is a solution using custom functions called deciles_interaction_plot and sextiles_interaction_plot, from https://pablobernabeu.github.io/2022/plotting-two-way-interactions-from-mixed-effects-models-using-ten-or-six-bins
library(lme4)
#> Loading required package: Matrix
library(sjPlot)
library(ggplot2)
theme_set(theme_sjplot())
# Create data partially based on code by Ben Bolker
# from https://stackoverflow.com/a/38296264/7050882
set.seed(101)
spin = runif(800, 1, 24)
trait = rep(1:40, each = 20)
ID = rep(1:80, each = 10)
testdata <- data.frame(spin, trait, ID)
testdata$fatigue <-
testdata$spin * testdata$trait /
rnorm(800, mean = 6, sd = 2)
# Model
fit = lmer(fatigue ~ spin * trait + (1|ID),
data = testdata, REML = TRUE)
#> boundary (singular) fit: see help('isSingular')
# plot_model(fit, type = 'pred', terms = c('spin', 'trait'))
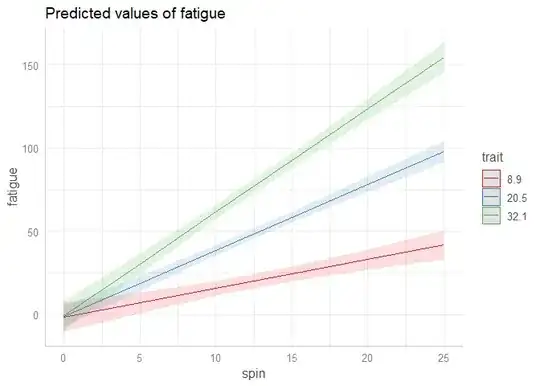
# Binning the colour variable into ten levels (deciles)
# Read in function from GitHub
source('https://raw.githubusercontent.com/pablobernabeu/language-sensorimotor-simulation-PhD-thesis/main/R_functions/deciles_interaction_plot.R')
deciles_interaction_plot(
model = fit,
x = 'spin',
fill = 'trait',
fill_nesting_factor = 'ID'
)
#> Loading required package: dplyr
#>
#> Attaching package: 'dplyr'
#> The following objects are masked from 'package:stats':
#>
#> filter, lag
#> The following objects are masked from 'package:base':
#>
#> intersect, setdiff, setequal, union
#> Loading required package: RColorBrewer
#> Loading required package: ggtext
#> Loading required package: Cairo
#> Warning in RColorBrewer::brewer.pal(n, pal): n too large, allowed maximum for palette Set1 is 9
#> Returning the palette you asked for with that many colors
#> Warning: Ignoring unknown parameters: linewidth
#> Scale for 'y' is already present. Adding another scale for 'y', which will
#> replace the existing scale.
#> Scale for 'colour' is already present. Adding another scale for 'colour',
#> which will replace the existing scale.

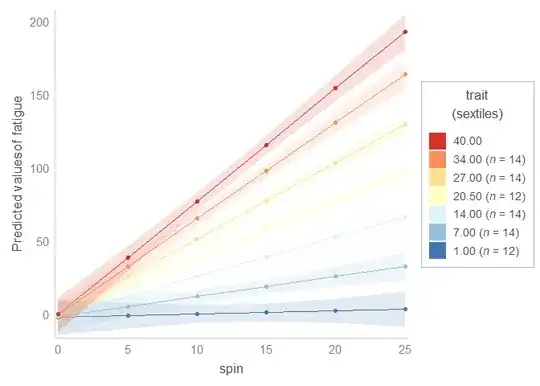
# If you wanted or needed to make six levels (sextiles) instead
# of ten, you could use the function sextiles_interaction_plot.

# Read in function from GitHub
source('https://raw.githubusercontent.com/pablobernabeu/language-sensorimotor-simulation-PhD-thesis/main/R_functions/sextiles_interaction_plot.R')

sextiles_interaction_plot(
  model = fit,
  x = 'spin',
  fill = 'trait',
  fill_nesting_factor = 'ID'
)
#> Warning: Ignoring unknown parameters: linewidth
#> Scale for 'y' is already present. Adding another scale for 'y', which will
#> replace the existing scale.
#> Scale for 'colour' is already present. Adding another scale for 'colour',
#> which will replace the existing scale.
Created on 2023-06-24 with reprex v2.0.2