I would like to arrange a list of plots and several lines of text in one graph using grid.arrange or ggarrange.
Following is what I have tried, but I prefer to use grid.arrange(grobs = plot_list, ncol = 2) combined with text, instead of typing plots in the list one by one, if possible.
(Refer to : How do I arrange a variable list of plots using grid.arrange?)
However, so far I haven't found a way to do it yet.
library(datasets)
library(ggplot2)
library(grid)
library(gridExtra)
d <- swiss[1:21, ]
my_list <- list()
for(i in 1:ncol(d)) {
my_list[[i]] <- d[ ,i]
}
d_plot <- data.frame(sj = 2000:2020, my_list)
names(d_plot) <- c("sj", "A", "B", "C", "D", "E", "F")
plot_function <- function(d_plot, y){
p <- ggplot(d_plot,aes_string(x = "sj", y = y)) +
geom_line()
return(p)
}
plot_list <- list()
indicators <- colnames(d_plot)[2:15]
for (i in 1:6){
y <- indicators[i]
plot_list[[i]] <- plot_function(d_plot, y)
}
text <- textGrob("BLA BLA BLA BLA BLA BLA BLA BLA BLA BLA BLA BLA
BLA BLA BLA BLA BLA BLA BLA BLA BLA BLA BLA BLA
BLA BLA BLA BLA BLA BLA BLA BLA BLA BLA BLA BLA
BLA BLA BLA BLA BLA BLA BLA BLA BLA BLA BLA BLA ")
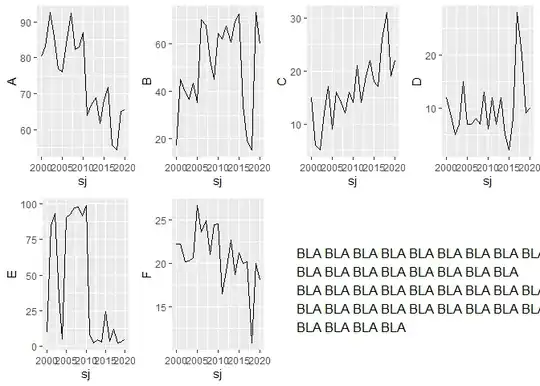
grid.arrange(plot_list[[1]],plot_list[[2]],plot_list[[3]],plot_list[[4]],
plot_list[[5]],plot_list[[6]],text,ncol=4)
 Also, how can I make the text "BLA BLA BLA" take up the last two blocks instead of just one, as well as left align the text, so that it looks better?
Thank you in advance!