Explanation
Using ggplot2 and ggsave it is possible to save the last displayed plot:
ggplot(data = data.frame(x = 1:10,
                         y = 1:10),
       aes(x = x,
           y = y)) +
 geom_point()

ggsave(filename = 'test.png',
       device = 'png')
However, ggsave does not save plots created without ggplot2:
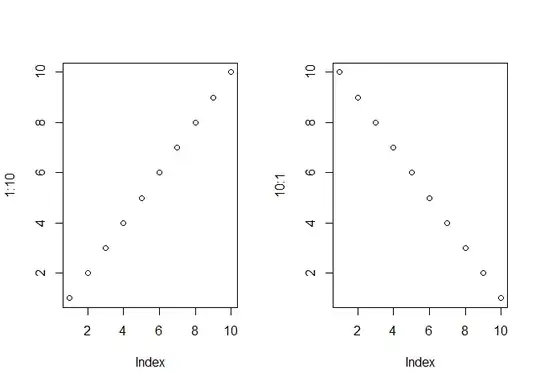
par(mfrow = c(1, 2))

plot(1:10)
plot(10:1)

par(mfrow = c(1, 1))

ggsave(filename = 'test.png',
       device = 'png')
Background information
Some of the single plots like plot(1:10) are (a) created by calling plot on specific objects or (b) created by calling specific methods from packages.
I am also interested in solving "the same" problem when using layout instead of par.
Question
Is there a way to achieve this? For example by adding something like an empty ggplot2-layer? Or by using a more straight forward ggplot2-plot?
Clarification
To be clear: I do not want to use the following code:
png(filename = 'test.png')

par(mfrow = c(1, 2))

plot(1:10)
plot(10:1)

par(mfrow = c(1, 1))

dev.off()