0

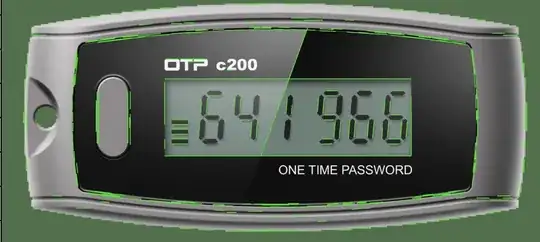
So say I have lots of images similar to these ones:

2 3

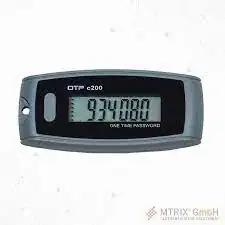
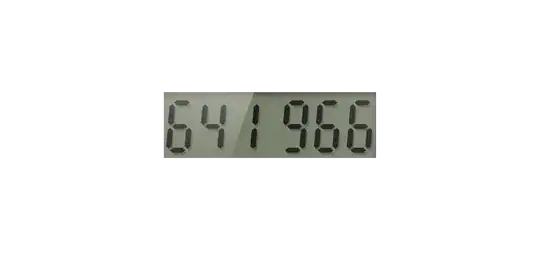
I am trying to get the rectangle with the numbers inside, its the one with the lighter background, also I would like to get rid of those lines but that isn't really as important, here is what it should look like:

5

I really just don't know how to go about solving this.

Here is the code I have, it recognizes the shapes and outlines them in green,

import numpy as np
import matplotlib.pyplot as plt
import cv2
import sys

# read the image from arguments
image = cv2.imread('OCRimgs/test2.jpg')

# convert to grayscale
grayscale = cv2.cvtColor(image, cv2.COLOR_BGR2GRAY)

# perform edge detection
edges = cv2.Canny(grayscale, 30, 100)

# detect lines in the image using hough lines technique
lines = cv2.HoughLinesP(edges, 1, np.pi/180, 60, np.array([]), 50, 5)
# iterate over the output lines and draw them
for line in lines:
    for x1, y1, x2, y2 in line:
        cv2.line(image, (x1, y1), (x2, y2), color=(20, 220, 20), thickness=3)

# show the image
plt.imshow(image)
plt.show()

output:

7

if it helps I am making a OCR that takes in images like the ones you saw at the top and gets their images, this might seem pointless but trust me once I finish it, it will be super helpful to me.

here is the code I have for the OCR(no bugs here)

import cv2
import pytesseract
# from PIL import Image

img = cv2.imread('small.png')

try:
    t = pytesseract.image_to_string(img, lang='lets', config='--psm 6 tessedit_char_whitelist=0123456789')
    text = int(t.replace('\n', '').replace('\f', ''))
    print(text)
except:
    print('Error processing image')

the images it takes in have to be similar to these:

5

edit:

I feel like there could be a way to do this by using the color of the rectangle because it is light, but I'm not sure it that will work as the real data will be images take from a camera (images will be taken from the same camera in the same spot)

Christoph Rackwitz
  • 11,317
  • 4
  • 27
  • 36

2 Answers2

0

If your having sufficient number of input images, train a model to recognize the region of interest rectangle you required and pass those detected regions to OCR for getting text.

User
  • 46
  • 1
  • 2
  • 11
  • Your answer could be improved with additional supporting information. Please [edit] to add further details, such as citations or documentation, so that others can confirm that your answer is correct. You can find more information on how to write good answers [in the help center](/help/how-to-answer). – Community Jul 10 '23 at 16:05
0
import cv2 as cv
import numpy as np
import pytesseract
import matplotlib.pyplot as plt

# Image path
path= "/Users/gauravsingh/Downloads/ejYknlr.jpeg"

# Read the image.
image = cv.imread(path, cv.IMREAD_COLOR)

# Convert the image to grayScale
imageGray = cv.cvtColor(image, cv.COLOR_BGR2GRAY)


# Apply Gaussian Blur to smooth the images.
imageBlur = cv.GaussianBlur(imageGray, (3, 3), sigmaX= 0)

# Perform Edge Detection
Canny = cv.Canny(imageBlur, 30, 100)

# detect lines in the image using hough lines technique
lines = cv.HoughLinesP(Canny, 1, np.pi/180, 60, np.array([]), 50, 5)
lines = sorted(lines, key=lambda line: np.linalg.norm(lines[0] -       lines[1]), reverse=False)

# Filter out lines which start and End on same points ony axis
logestLine = []

for line in lines:
  for x1, y1, x2, y2 in line:
     if y1 == y2:
        logestLine.append([(x1, y1), (x2, y2)])

# Crop the area
x1, y1= logestLine[0]
x2, y2= logestLine[1]
x= x1[0]
y = x2[1]
xi, yi= y1

imageCropped = image[y:yi, x:xi]


# Display image
plt.imshow(imageCropped[:,:,::-1])
plt.show()

Here is the result: CroppedImage

  • 1
    As it’s currently written, your answer is unclear. Please [edit] to add additional details that will help others understand how this addresses the question asked. You can find more information on how to write good answers [in the help center](/help/how-to-answer). – Community Aug 28 '23 at 19:12