My goal is to have a function in which can input specific column and df names, in order to output graphs in a consistent format. However, I am having some trouble with creating functions using ggplot2, because of problems with column name recognition. So far, I haven't had any success with any of the fixes people have proposed in other questions addressing this issue.
Using a test dataset as an example, this is what I tried first
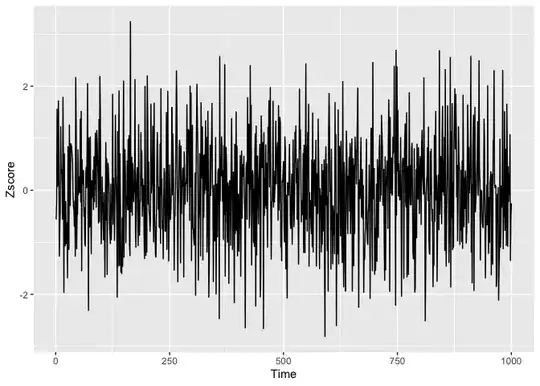
set.seed(123)

MYdata1 <- data.frame(Time = 1:1000,
                    Zscore = rnorm(1000))

plot_testassess <- function(data1,xvar = "Time",yvar = "Zscore"
){ggplot(data = data1, aes(.data[[xvar]], .data[[yvar]]))}

plot_testassess(MYdata1,Time,Zscore)
However, I kept getting the error
Error in enquo(x) : object 'Time' not found
so then I tried aes_string, like this :
plot_testassess <- function(data1,xvar = "Time",yvar = "Zscore"
){ggplot(data = data1, aes_string(x=xvar,y=yvar))}

plot_testassess(MYdata1,Time,Zscore)
But in this case I got the following error.
Error in aes_string(x = xvar, y = yvar) : object 'Time' not found
I am at a loss as to how to make ggplot2 recognise that my column variables are not objects. Does anyone have any thoughts?