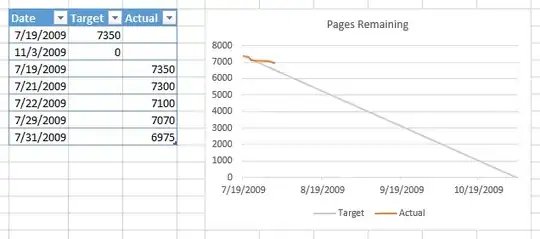
I have tried looking online for ways to plot all of the x-variables on the x-axis of an R plot. However my problem is a too simple and its hard to understand more advance scripts.
I tried using scale_x_continuous however I keep getting the error of object not found. I'm having trouble setting up my variables. Also, I don't even know if scale_x_continuous would work to help display all of my x- variables on the x-axis.


