0

Sorry, if that has been already solved somewhere, but the solutions I've seen so far doesn't really work for me.

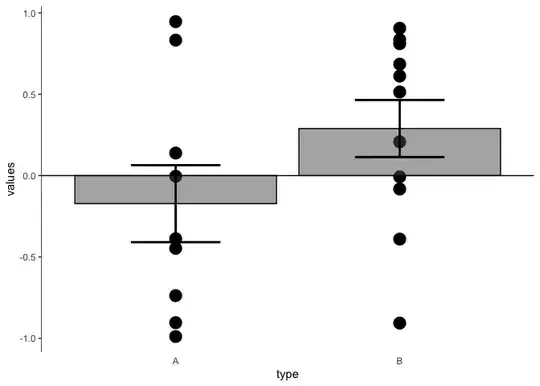
Let's say we have a this data and I want to plot it as a bar graph with individual values:

library(ggplot2)
seed(42)

data <- data.frame(type = sample(LETTERS[1:2], replace = TRUE, 20), values = runif(20)*c(-1, 1))

ggplot(data, aes(x = type, y = values)) +
 geom_point(size = 5)+
 stat_summary(fun=mean, geom='bar', color = "black", alpha = 0.5) +
 stat_summary(fun.data=mean_se, geom='errorbar', width=0.4, size = 1)+
 theme_classic()

Resulting in: enter image description here

I want to have x-axis intercepting y-axis at 0 and still have labels for "type" on the bottom. If I just draw geom_hline at "0" then I have two x-axises which is not really preferrable.

How would you move the actual x-axis here ? Thanks a lot!

Eugene
  • 85
  • 8
  • 1
    See https://stackoverflow.com/a/73566140/3358272 for one way using the `ggh4x` package. In general, it seems most other ggplot-native implementations can be rather laborious. – r2evans Jul 12 '23 at 17:26

1 Answers1

2

One option would be the ggh4x package which via ggh4x::coord_axes_inside allows for interior axes:

library(ggplot2)
library(ggh4x)

set.seed(42)

data <- data.frame(type = sample(LETTERS[1:2], replace = TRUE, 20), values = runif(20)*c(-1, 1))

ggplot(data, aes(x = type, y = values)) +
  geom_point(size = 5)+
  stat_summary(fun=mean, geom='bar', color = "black", alpha = 0.5) +
  stat_summary(fun.data=mean_se, geom='errorbar', width=0.4, size = 1) +
  coord_axes_inside() +
  theme_classic()

stefan
  • 90,330
  • 6
  • 25
  • 51