Using ggplot, I want to add an annotation that describes the mean value of an axis, and I wish to make this calculation on the fly, rather than a preemptive calculation that assigns a value to a dedicated object.
Example
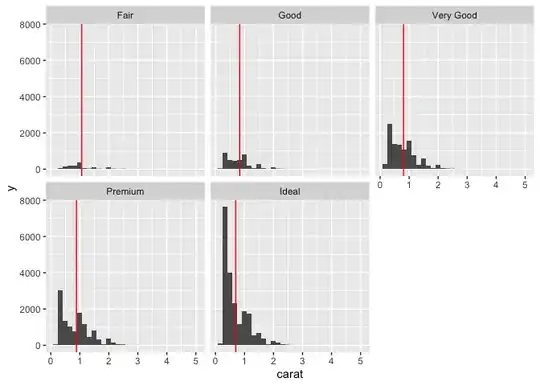
Consider the following carat histogram by cut:
library(ggplot2)
library(dplyr)
#>
#> Attaching package: 'dplyr'
#> The following objects are masked from 'package:stats':
#>
#>     filter, lag
#> The following objects are masked from 'package:base':
#>
#>     intersect, setdiff, setequal, union

diamonds |>
  filter(depth > 60) |>
  ggplot(aes(carat)) +
  geom_histogram() +
  stat_summary(aes(xintercept = after_stat(x), y = 0),
               fun = mean,
               geom = "vline",
               orientation = "y",
               color = "red") +
  facet_wrap(~cut)
#> `stat_bin()` using `bins = 30`. Pick better value with `binwidth`.
Created on 2023-07-13 with reprex v2.0.2
Desired Output
Can I tuck another line of code to the ggplot composition that will add an annotation for "Mean Carat = mean(carat)" and it will do the mean calculation per facet?
Pseudo Plot

