I am making a plot matrix using subplots in matplotlib with a shared x and y axis. What I am looking to do is label the x and y groups similar to how they are labeled in the default JMP graph maker.
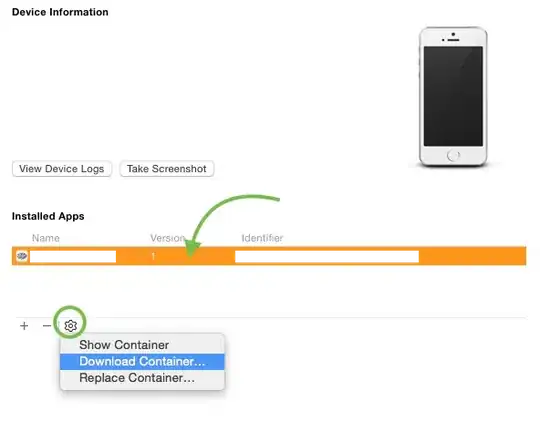
In the below image, all of the blue items are what I already have, and the red items are what I am looking to add to the plot.