3

I am working with the R programming language.

I came across the following math puzzle recently:

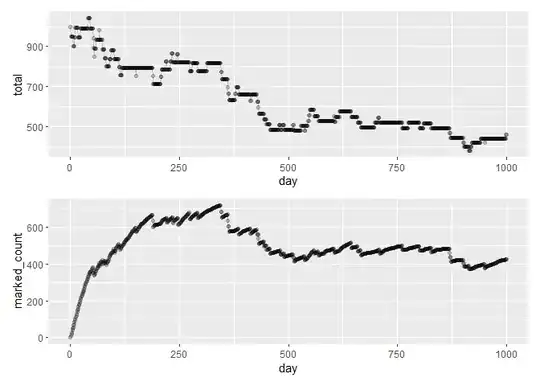
  • Suppose there is a pond with 100 fish
  • Each day, there is a 5% chance that population of the pond increases by 5% of its current population
  • A 5% chance that the population of the pond decreases by 5% of its current population a 90% chance that the population of the pond stays the same

I wrote some R code to represent the size of the pond over 1000 days:

set.seed(123)
n_days <- 1000
pond_population <- rep(0, n_days)
pond_population[1] <- 100


for (i in 2:n_days) {
    prob <- runif(1)
    if (prob <= 0.05) {
        pond_population[i] <- pond_population[i-1] + round(pond_population[i-1] * 0.05)
    } else if (prob > 0.05 && prob <= 0.10) {
        pond_population[i] <- pond_population[i-1] - round(pond_population[i-1] * 0.05)
    } else {
        pond_population[i] <- pond_population[i-1]
    }
}


plot(pond_population, type = "l", main = "Pond Population Over Time", xlab = "Day", ylab = "Population")

enter image description here

My Question: I am curious about the following modification to this problem - suppose each day you catch 10 distinct fish from this pond, tag these fish, and then put them back into the pond. Naturally, it is possible that some days you will catch fish that you previously caught in the past - and it is also possible that some of the fish you caught in the past will die. After you have finished fishing on the 1000th day - what percent of the current fish pond population will be known to you?

I am interested in learning how to write a simulation procedure to answer this question - something that can be added to code I already wrote that keeps track of the size of fish pond population each day as well as the individual fish within the pond that you have already seen (e.g. imagine if each fish is assigned a unique ID).

I am not sure how to begin this problem - I think I might have to use "stacks" or "queues" for this problem, but I am not familiar with these concepts and how they would be used here.

Can someone please show me how to do this?

Thanks!

stats_noob
  • 5,401
  • 4
  • 27
  • 83

2 Answers2

4

Here's one approach

library(tidyverse)

set.seed(123)

fish_pond_sim <- function(pop=100, days=1000, fished_per_day=10) {
    fish <- tibble(
            id = 1:pop,
            seen = FALSE,
            dead = FALSE
            )

    results <- tibble(
        population = pop,
        day = 1,
        seen = 0,
        dead = 0,
        seen_and_alive = 0
    )
    living <- pop
  for (i in 2:days) {
    prob <- runif(1)
    five_percent <- round(length(living) * 0.05)
    if (prob <= 0.05) {
      five_pct_sample <- sample(living, five_percent, replace = FALSE)
      fish[fish$id %in% five_pct_sample,]$dead <- TRUE
    } else if (prob > 0.05 && prob <= 0.10) {
      fish <- fish %>% add_row(
        id = max(fish$id):(max(fish$id) + five_percent), 
        seen = FALSE,
        dead = FALSE
      )
    }

    fished_sample <- sample(living, fished_per_day, replace = FALSE)
    fish[fish$id %in% fished_sample,]$seen <- TRUE
    living <- fish[!fish$dead,]$id
    results <- results %>% add_row(
      population = length(living),
      day = i,
      seen = sum(fish$seen),
      dead = sum(fish$dead),
      seen_and_alive = sum(fish$seen & !fish$dead)
    )
  }
    return(results)
}

result <- fish_pond_sim(1000, 1000) 

result %>% 
    ggplot(aes(x = day)) +
    geom_line(aes(y = population, color = "Population")) +
    geom_line(aes(y = seen_and_alive, color = "Seen and Alive")) + 
    theme_bw()

plot of fish

To get the percentage which will be known to you, you can do something like this:

result %>%
    slice_tail() %>%
    pull(seen_and_alive_percentage) # 84.00424
Mark
  • 7,785
  • 2
  • 14
  • 34
  • 1
    @ Mark: Thank you so much for your answer! Is it possible to modify this code to answer: After you have finished fishing on the 1000th day - what percent of the current fish pond population will be known to you? Thank you so much! – stats_noob Jul 17 '23 at 06:59
  • @stats_noob updated – Mark Jul 17 '23 at 07:10
  • 1
    @ Mark: Thank you so much for your update! I accepted your answer - if you have time, can you please update the ggplot graph as well? thank you so much! – stats_noob Jul 20 '23 at 02:35
  • update it with what? @stats_noob – Mark Jul 20 '23 at 02:35
  • As per your suggestion - "It would probably be more accurate to instead show the number of the alive fish we have seen". Is it possible to show this? Thank you so much! – stats_noob Jul 20 '23 at 02:36
  • Oh right! yeah sure – Mark Jul 20 '23 at 02:37
  • @stats_noob done! – Mark Jul 20 '23 at 02:53
  • 1
    @ Mark: Thank you so much! – stats_noob Jul 20 '23 at 02:53
  • interesting thing about the population thing - if you decrease the population size, we see almost all fish (the lines overlap almost perfectly) – Mark Jul 20 '23 at 02:54
  • @ Mark: I have been thinking about this problem for some time now. I have been trying to think how to write mathematical formulas to estimate the probabilities and evaluate the limiting behaviors of the fish pond – stats_noob Jul 20 '23 at 03:00
  • If you are interested, you can check out these questions I asked: https://math.stackexchange.com/questions/4735898/what-is-the-probability-of-knowing-someone-in-the-office – stats_noob Jul 20 '23 at 03:00
  • https://math.stackexchange.com/questions/4731910/how-to-create-a-mathematical-model-of-an-elevator – stats_noob Jul 20 '23 at 03:01
  • 1
    very interesting! particularly the elevator problem. But my instinct is to model it programatically, as a stream of people arriving at the elevator every n seconds, rather than two separate markov chain models – Mark Jul 20 '23 at 03:23
  • 1
    thank you so much! I am very curious to see if someone will recommend any mathematical approaches to model these problems ... would sure make my time in the elevator go faster lol! – stats_noob Jul 20 '23 at 03:24
  • 1
    @ Mark: Unrelated question: do you have any ideas about how to solve this? https://stackoverflow.com/questions/76701351/html-xml-understanding-how-scroll-bars-work – stats_noob Jul 20 '23 at 04:21
  • Let us [continue this discussion in chat](https://chat.stackoverflow.com/rooms/254602/discussion-between-stats-noob-and-mark). – stats_noob Jul 21 '23 at 03:02
  • I tried to solve a related question a few days ago - can you please take a look at this question if you have time? I would be curious to know your thoughts! Thank you so much! https://stackoverflow.com/questions/76607184/r-writing-a-random-sampling-procedure-for-coin-flips – stats_noob Jul 21 '23 at 03:03
  • @stats_noob I posted my first question! Voronoi + graph related I would be curious to know what you think! :-) https://stackoverflow.com/questions/76896221/generate-teams-of-similar-strengths-with-contiguous-areas – Mark Aug 14 '23 at 07:16
  • 1
    great question! I have also wondered about these kinds of questions myself! I hope it gets answered soon! – stats_noob Aug 14 '23 at 12:48
  • 1
    btw you might find this interesting - here is a clustering algorithm that is meant for geospatial data to ensure that the clusters touch: https://www.dshkol.com/post/spatially-constrained-clustering-and-regionalization/ – stats_noob Aug 14 '23 at 12:48
  • thank you for sharing that @stats_noob :-) you're welcome to try answering I might put up a bounty when I'm able to – Mark Aug 14 '23 at 13:06
  • 1
    @stats_noob I had a read of the article you posted - it's interesting! I like the region-based clustering idea, but the issue is, they are calculating edge costs based on differences between nodes, which they only need to do once, whereas I'm still trying to figure out the cost function, and it would likely have to be recalculated after each step :'( – Mark Aug 14 '23 at 13:34
  • Hey Mark, I would like to place a bounty on your question (https://stackoverflow.com/questions/76896221/generate-teams-of-similar-strengths-with-contiguous-areas) as a way to thank you for all the kind help you have provided me over the last few weeks - will that be ok? – stats_noob Aug 18 '23 at 20:12
  • @stats_noob that would be very sweet! I was thinking of putting one on your question haha. I couldn't decide which one though. I was also thinking of putting one on mine too – Mark Aug 19 '23 at 06:32
  • @stats_noob I put a bounty on it! https://stackoverflow.com/questions/76896221/generate-teams-of-similar-strengths-with-contiguous-areas . Unsure if the bounty is large enough, but hopefully I get some good answers! :-) – Mark Aug 21 '23 at 09:45
  • you beat me to it :( I was feeling unwell these past few days and have not been vesting this website as frequently... do you have another question I can post one on? – stats_noob Aug 21 '23 at 15:39
  • oh I'm sorry to hear that @stats_noob! :-( hope you have been resting up and feel better soon – Mark Aug 21 '23 at 15:40
  • I'll have to think of something! I wish I had a fraction of the ideas you have- I generally have one idea and then can't stop thinking about it for a year or two – Mark Aug 21 '23 at 15:42
  • haha i think we'd make a good team lol! btw are you a student? what industry are you in? – stats_noob Aug 21 '23 at 16:40
  • we were talking about this question earlier - I think someone was finally able to come up with an answer! https://stackoverflow.com/questions/76981649/how-to-approximate-polygons-postal-code-zones-from-point-data – stats_noob Aug 30 '23 at 17:18
  • hi @stats_noob! I'm sorry for taking so long to reply to you. I'm going through a bit of a rough time :( I'm studying a bit, in economics, but study isn't going so well (i get easily distracted by other things, e.g. StackOverflow). Just quit a non-coding related job with the hope of getting a coding related one – Mark Sep 01 '23 at 02:09
3

It wasn't clear what you meant by you want "alternate and new ways to solve this problem". Here's my attempt using vectorized functions in R's dplyr:: and purrr:: libraries for succinct code.

Final data shows 93% of fishes are known/marked in the end!

library(tidyverse) ; 
#> Warning: package 'ggplot2' was built under R version 4.2.3
#> Warning: package 'tibble' was built under R version 4.2.3
#> Warning: package 'tidyr' was built under R version 4.2.3
#> Warning: package 'readr' was built under R version 4.2.3
#> Warning: package 'purrr' was built under R version 4.2.3
#> Warning: package 'dplyr' was built under R version 4.2.3
#> Warning: package 'stringr' was built under R version 4.2.3
#> Warning: package 'forcats' was built under R version 4.2.3
library(patchwork) # for composing plots


# initialization
fishes <- rep(0, 1000) # 0 represents all the fish in the pond ; 1 are the marked fishes

prob_change <- .05 # probability of population increase = prob of population decrease
frac_change <- .05 # population fraction change with every day
fish_caught <- 10 # number of fish caught for marking

num_of_days <- 1000 # number of days for simulation to run


# Single simulation run
next_day <- function(fishpop, dummy)
{
  # difference in population size to increase or decrease
  pop_diff <- round(frac_change * length(fishpop)) # 5% of current population
  
  pop_red <- length(fishpop) - pop_diff
  
  # random variable 
  p = runif(1)
  
  # new population
  fishpop_list <- 
    case_when( # a vectorized if_else statement from dplyr:: package
      p <= prob_change ~ list(sample(fishpop, size = pop_red)), # subsample from current population (5% less)
      p >= (1 - prob_change) ~ list(c(fishpop, rep(0, pop_diff))), # add to current population
      .default = list(fishpop)
  )
  
  fishpop <- fishpop_list[[1]] # extract population from the list
  
  # fishing and marking with 1
  fishpop[sample(length(fishpop), size = fish_caught)] <- 1
  
  return(fishpop)
}


# run simulation over many days

# create iterator list : first element is the initial fish state ; others are dummies
iterator <- as.list(0:num_of_days)
iterator[[1]] <- fishes


# data frame to store daily stats and the simulations
daily_stats <- 
  tibble(day = 0:num_of_days,
         iterator = iterator) %>% 
  
  # run simulation for each day, store resulting fish state in "fishes" and use result for next iteration
  mutate(fishes = accumulate(iterator, next_day)) %>% 
  
  # summarize data
  mutate(total = map_int(fishes, length),
         marked_count = map_int(fishes, ~length(.x[.x == 1])),
         fraction_marked = marked_count / total)


# plotting
total_count <- 
  ggplot(daily_stats, aes(day, total)) + 
  geom_point(alpha = 0.2) + geom_line(alpha = 0.2)

marked_count <- 
  ggplot(daily_stats, aes(day, marked_count)) + 
      geom_point(alpha = 0.2) + geom_line(alpha = 0.2)

# show plots : one below the other
total_count / marked_count


# Show fraction of fish population marked
daily_stats %>% select(-2, -3) %>% tail
#> # A tibble: 6 × 4
#>     day total marked_count fraction_marked
#>   <int> <int>        <int>           <dbl>
#> 1   995   438          422           0.963
#> 2   996   438          422           0.963
#> 3   997   438          423           0.966
#> 4   998   438          425           0.970
#> 5   999   460          428           0.930
#> 6  1000   460          428           0.930

Created on 2023-08-01 with reprex v2.0.2