0
ggplot(data = plot_2022points_ALL, aes(ScoringSystem, Rank)) +
  ggbump::geom_bump(linewidth = 1.5,
                    mapping = aes(group=player_display_name, 
                                  color= I(team_color))) +
  geom_point(aes(group=player_display_name, color=I(team_color2)),
             size=4) +
  geom_text(data = plot_2022points_ALL %>% filter(ScoringSystem == "ENOsysrank"),
            aes(label=player_display_name,
                color=position_group),
            size = 4,
            fontface = "bold",
            nudge_x = -0.2,
            hjust = 1)

When I pass this code it returns the error:

Error in `geom_text()`:
! Problem while converting geom to grob.
ℹ Error occurred in the 3rd layer.
Caused by error:
! Unknown colour name: QB

Everything else I have found online says to just put the color variable inside of aes() but I have already done that. Is this because other geoms use the I() function for their color mappings? However, I would expect that the color mappings of other geoms would not affect the others...

Here is an example of what my data looks like:

position_group player_display_name team points ScoringSystem Rank team_color
QB Patrick Mahomes KC 485.4 ENOsysrank 1 #E31837
TE Justin Jefferson MIN 378.7 PPR 6 #4F2683

I tried putting the color aes into the ggplot() function and deleting the color= inside of the geom aes, but that didn't work.

Edit for clarity: I would like the geom_text to be colored according to position_group whereas the other two geoms colored according to the hex values in team_color
  • Does your code produce the expected output if you remove the `I()`'s? I.e. `color= team_color` instead of `color= I(team_color)`? – jared_mamrot Jul 25 '23 at 01:13
  • if I remove the `I()`, then it does not register the hex values in the `team_color` column as colors, but rather treats them as text. I want `geom_point` and `geom_bump` to be colored according to the hex values in `team_color`, but `geom_text` to be colored automatically by ggplot according to `position_group` – Ethan Okoshi Jul 25 '23 at 01:31
  • Does this answer your question? [How to set multiple legends / scales for the same aesthetic in ggplot2?](https://stackoverflow.com/questions/17642190/how-to-set-multiple-legends-scales-for-the-same-aesthetic-in-ggplot2) – Dan Adams Jul 25 '23 at 01:43
  • This is a duplicate of: https://stackoverflow.com/questions/17642190/how-to-set-multiple-legends-scales-for-the-same-aesthetic-in-ggplot2 and https://stackoverflow.com/questions/18347147/using-two-scale-colour-gradients-ggplot2 – Dan Adams Jul 25 '23 at 01:43

1 Answers1

1

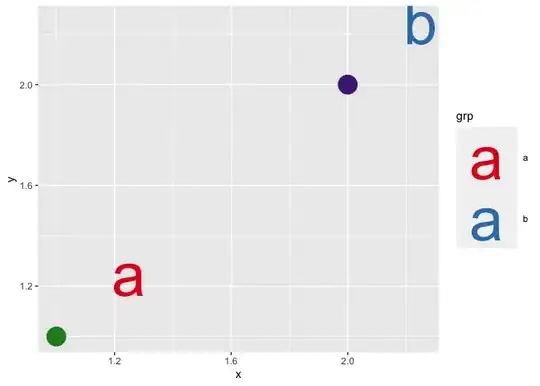
If you want ggplot2 to map the color directly from your variable, you need scale_color_identity() and remove the I().

You cannot get an additional, separate color scale with base ggplot2. There are several extension packages which have some variant of this functionality. Here it is with ggnewscale. For more check related answer here: https://stackoverflow.com/a/70937627/13210554 and Using two scale colour gradients ggplot2

library(tidyverse)
library(ggnewscale)

d <- data.frame(grp = c("a", "b"),  x = 1:2,  y = 1:2,  col = c("forestgreen", "#4F2683"))

ggplot(d, aes(x, y)) +
  geom_point(aes(color = col), size = 8) +
  scale_color_identity() +
  new_scale_color() +
  geom_text(aes(x = x + 0.25, y = y + 0.25, label = grp, color = grp), size = 20) +
  scale_color_brewer(palette = "Set1") 

Created on 2023-07-24 with reprex v2.0.2

Dan Adams
  • 4,971
  • 9
  • 28
  • I would like the geom_text to use the position_group variable for coloring. The team_color variable is used in another geom. – Ethan Okoshi Jul 25 '23 at 01:29