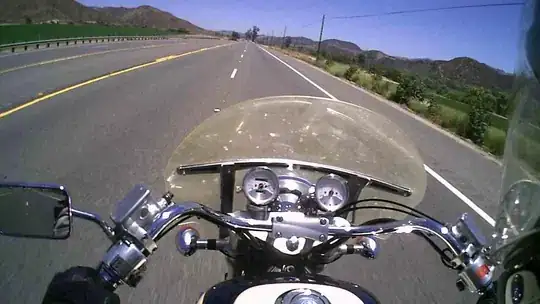
The resolution of the second example image is incredibly low in terms of the number of pixels and in terms of its contrast:

And it's possible that images can be below the threshold resolution for any sort of computer vision to work.
Another way would be to process the image through a kernel filter and then set a threshold for the pixel values in another numpy array of zeros and populate it with ones where it crosses the threshold:
from skimage import io as io
image1 = image_path=io.imread('https://i.stack.imgur.com/FDN4R.jpg')

import numpy as np
def normalize_rgb_values(rgb_values, max_value=1.0):
    norm_rgb_values = (rgb_values - np.mean(rgb_values)) / np.var(rgb_values)**0.5
    norm_rgb_values += abs(np.min(norm_rgb_values))
    norm_rgb_values *= (max_value / np.max(norm_rgb_values))
    return np.round(norm_rgb_values, decimals=0).astype(int) if max_value == 255 else np.round(norm_rgb_values, decimals=9).astype(float)

_kernel = np.diag([-5.0, 1.0, 1.0])
from matplotlib import pyplot as plt
plt.imshow(_kernel)
plt.show()

_image1 = np.zeros((image1.shape[0] + _kernel.shape[0]*2, image1.shape[1] + _kernel.shape[1]*2, 3)).astype(float)
_image1[_kernel.shape[0]:-_kernel.shape[0], _kernel.shape[1]:-_kernel.shape[1], :] = image1
image1 = normalize_rgb_values(_image1, max_value=255)
plt.imshow(image1)
plt.show()

def filter_image(image1, _kernel):

    def yield_row_col_rgb_sums(image1, _kernel):
        for row in range(image1.shape[0] - _kernel.shape[0]):
            for col in range(image1.shape[1] - _kernel.shape[1]):
                for rgb in range(3):
                    yield np.sum(image1[row:row + _kernel.shape[0], col:col + _kernel.shape[1], rgb]*_kernel)

    return np.reshape(list(yield_row_col_rgb_sums(image1, _kernel)), [image1.shape[0] - _kernel.shape[0], image1.shape[1] - _kernel.shape[1], image1.shape[2]])

processed_image = normalize_rgb_values(filter_image(image1, _kernel))
plt.imshow(processed_image)
plt.show()

final_image = np.zeros((processed_image.shape[0], processed_image.shape[1])).astype(float)
final_image[np.where(np.sum(processed_image, axis=2) >= 1.385)] = 1.0
plt.imshow(final_image)
plt.show()

black_and_white_final_image = final_image
black_and_white_final_image.shape += (1,)
black_and_white_final_image = np.concatenate([black_and_white_final_image for _ in range(3)], axis=2)
plt.imshow(black_and_white_final_image)
plt.show()
Outputs:

EDIT for removing background
If we have additional parameters and fine tune the summed values threshold from the processed image a bit then we can get rid of (most of) the background:
final_image = np.zeros((processed_image.shape[0], processed_image.shape[1])).astype(float)
final_image[np.where(np.sum(processed_image, axis=2) >= 1.385)] += 1.0
final_image[np.where(np.sum(processed_image, axis=2) >= 1.75)] += 1.0
final_image[np.where(final_image == 2.0)] = 0.0
plt.imshow(final_image)
plt.show()

black_and_white_final_image = final_image
black_and_white_final_image.shape += (1,)
black_and_white_final_image = np.concatenate([black_and_white_final_image for _ in range(3)], axis=2)
plt.imshow(black_and_white_final_image)
plt.show()
Outputs: