I am using an autoplot to visualise my PCA and need to add code names to each individual point but can't work out how to do it.
I have tried using geom_text but this only seems to work if using ggplot and when adding labels = TRUE, this just adds numbers to each point, instead of the code names in the original data.
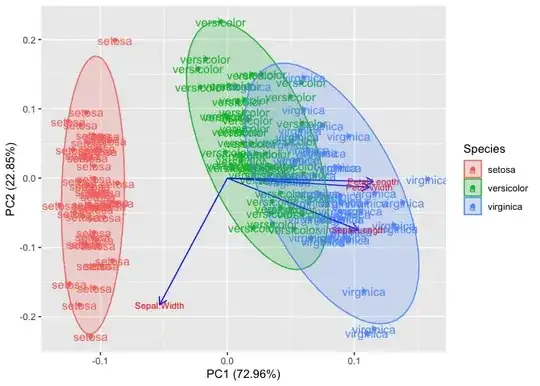
this is the code I used to create the autoplot with the iris dataset from r
library(ggfortify)
df <- iris[1:4]
pca_res <- prcomp(df, scale. = TRUE)
autoplot(pca_res, data = iris, colour = 'Species',
     loadings = TRUE, loadings.colour = 'blue',
     loadings.label = TRUE, loadings.label.size = 3, frame = TRUE, frame.type = 'norm')