I am trying to create a gantt-chart with highcharter in R close to this with a table as x-Axis and as y-Axis. On the x-Axis I want the day of the year and the week of the year and the actual date.
# Server -----------------------------------------------------------------------
GanttServer <- function(id) {
  moduleServer(
    id,
    function(input, output, session) {
      ns <- session$ns

      # Dummy-Tabelle
      set.seed(1234)
      size <- 6
      df <- tibble(
        start = today() + days(sample(5:400, size = size)),
        end = start + days(sample(1:100, size = size, replace = TRUE)),
        #print(start),
        #print(end),
        category = rep(1:3, length.out = size) - 1
      ) %>%
        # needs to convert to highchart timestamp format
        mutate(
          start = datetime_to_timestamp(start),
          end = datetime_to_timestamp(end)
        )

      # Unique categories
      unique_categories <- unique(df$category)
      progress <- sample(c("80%", "12%", "56%"), length(unique_categories))
      actions <- sample(c("Install", "Water refill", "Gas refill"), length(unique_categories))

      # Generate data with unique progress for each category
      df <- df %>%
        mutate(progress = progress[match(category, unique_categories)]) %>%
        mutate(action = case_when(
          progress == "80%" ~ "Install",
          progress == "56%" ~ "Water refill",
          progress == "12%" ~ "Gas refill",
        ))

      # Generate unique sday and eday values for each row
      df <- df %>%
        mutate(sday = sample(1:4, nrow(.), replace = TRUE),
               eday = sample(5:10, nrow(.), replace = TRUE))

      NoOfDays <- (df$end[1] - df$start[1]) / (1000*60*60*24)
      date <- as.POSIXlt(df$start[1] / 1000, origin = "1970-01-01")
      dayOfYear <- date$yday + 1

      dfx <- tibble(
        days = seq(dayOfYear, (NoOfDays + dayOfYear))
      )

      output$gantt_chart <- renderHighchart({
        hchart(df, type = "gantt",
               mapping = hcaes(x=start, x2=end, y = category, partialFill = progress),
               dataLabels = list(enabled = TRUE)) %>%
          hc_title(text = 'Table') %>%
          hc_tooltip(
            headerFormat = '',
            pointFormat = paste0('<b>{point.action}</b><br>',
                                 '{point.start:%e. %b} - {point.end:%e. %b}'),
            useHTML = TRUE
          ) %>%

          hc_xAxis(type = "category",
                   categories = dfx$days,
                   grid = list(enabled=TRUE, borderColor = "rgba(0,0,0,0.3)", borderWidth = 2,
            columns = list(
              list(
                title = list(text="Calendar Weeks"),
                labels = list(format = "{point.week}")
              ),
              list(
                title = list(text="Calendar Days"),
                labels = list(format = "{value}")
              ),
              list(
                title = list(text="Date"),
                labels = list(format = "{point.week_day_month}")
              )
            )),
            tickPixelInterval = NULL
          ) %>%


          hc_yAxis(type = "category", grid = list(enabled = TRUE, borderColor = "rgba(0,0,0,0.3)", borderWidth = 2,
            columns = list(
              list(
                title = list(text = ""),
                labels = list(format = "{point.action}")
              ),
              list(
                title = list(text = "Progress"),
                labels = list(format = "{point.progress}")
              ),
              list(
                title = list(text = "Planned<br/>starting<br/>day", y=-31),
                labels = list(format = "{point.sday}")
              ),
              list(
                title = list(text = "Planned<br/>finishing<br/>day", y=-31),
                labels = list(format = "{point.eday}")
              ),
              list(
                title = list(text = "Planned<br/>start<br/>date", y=-31),
                labels = list(format = "{point.start:%e. %b}")
              ),
              list(
                title = list(text = "Planned<br/>finishing<br/>date", y=-31),
                offset = 30,
                labels = list(format = "{point.end:%e. %b}")
              )
            )
        ))
      })

    }
  )
}
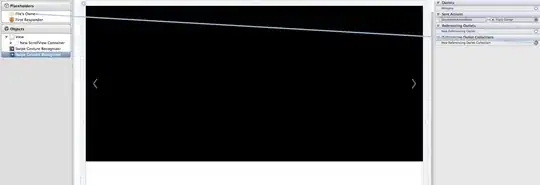
The image shows the output at the moment.
My problem is that I dont know how to fix the calendar days (I did not try with the weeks and actual date yet). In the end it should show every day and every week, exactly like in the gantt chart from the example (https://www.highcharts.com/demo/gantt/left-axis-table), but it should show numbers instead of letters. Maybe it would work better with type = "datetime" instead of "category".
It would also already help a lot if someone could translate the code from the example chart (https://www.highcharts.com/demo/gantt/left-axis-table) to R-code.
