0

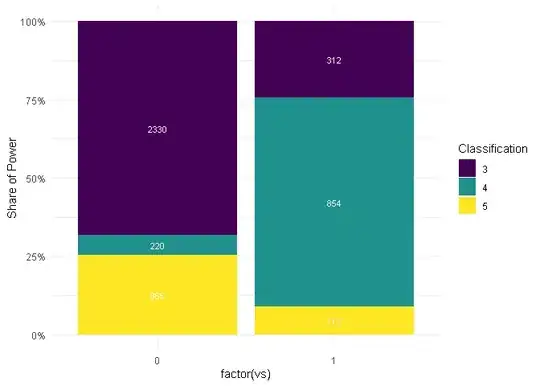
I have a variable that I want to visualise as a stacked bar chart the proportion of the total (in my case, the proportion of students but there are part students) that fall into each group. But I want the total (count of students, but taking into account the part students) as the label for each piece of the bar.

MWE using cars:

library(tidyverse)

testPlot <- mtcars %>% 
  select(mpg, disp, hp, vs, gear) %>% 
  mutate(gearFactor = factor(gear))

ggplot(testPlot, aes(x = vs, y = hp, fill = gearFactor)) +
  geom_col(position = "fill") + 
#  geom_text(aes(label = after_stat(y)), stat = "summary", fun = sum,
#            size = 3, colour = "white", position=position_fill(vjust=0.5)) +
  scale_y_continuous(name = "Share of Power", labels = scales::percent) +
  scale_fill_viridis_d(name = "Classification") +
  theme_minimal()

This code works fine and produces a stacked bar plot.

enter image description here

The problem is the labels. I want each of the bar sections to have the sum of the variable 'hp'. I have found various posts such as How do you add quantifying "count" labels to bar graphs made with ggplot2 in R? that use geom_text(aes(label = ..count..), stat = "count", position = "fill") and I know that after_stat() has replaced the ..STAT.. approach but haven't used it before. The answer at draw the sum value above the stacked bar in ggplot2 is where I got the labelling calculation.

If I uncomment my labelling lines, I get the error

Error: Discrete value supplied to continuous scale

Have tried various edits and just can't make it work. Other attempts have messed up the scaling or other failures. Can someone please tell me what I am doing wrong?

JenB
  • 17,620
  • 2
  • 17
  • 45
  • 1
    Can't reproduce your issue. If I add the `geom_text` I get your desired result: https://i.stack.imgur.com/wloOw.png. Using ggplot2 3.4.2 – stefan Aug 03 '23 at 19:45
  • 1
    I can't replicate either. Worked fine for me as well. What is your output of `sessionInfo()`? What version of `ggplot2` are you using? – MrFlick Aug 03 '23 at 19:50
  • Interesting, I guess that explains why I can't work out my bug. ggplot is 3.3.5 - I will update and see if that fixes it. – JenB Aug 03 '23 at 20:24
  • I needed to update both R and ggplot, but now working. Thank you – JenB Aug 03 '23 at 21:40

1 Answers1

0
library(tidyverse)
#> Warning: package 'tidyverse' was built under R version 4.2.2
#> Warning: package 'ggplot2' was built under R version 4.2.3
#> Warning: package 'tibble' was built under R version 4.2.3
#> Warning: package 'tidyr' was built under R version 4.2.2
#> Warning: package 'readr' was built under R version 4.2.2
#> Warning: package 'purrr' was built under R version 4.2.2
#> Warning: package 'dplyr' was built under R version 4.2.3
#> Warning: package 'stringr' was built under R version 4.2.2
#> Warning: package 'forcats' was built under R version 4.2.2
#> Warning: package 'lubridate' was built under R version 4.2.2

mtcars_tibble <- mtcars %>%
  as_tibble() %>%
  select(mpg, disp, hp, vs, gear) %>% 
  mutate(gearFactor = factor(gear)) 

# In the past I have done this by 
# transforming the data before sending it GGPLOT
mtcars_tibble %>%
  group_by(vs, gearFactor) %>%
  summarize(
    hp = sum(hp)
  ) %>%
  ungroup() %>%
  mutate(
    hp_pct = hp / sum(hp)
  ) %>%
  ggplot(
    mapping = aes(
      x = factor(vs),
      y = hp_pct,
      fill = gearFactor
    )
  ) +
  geom_col(
    position = "fill"
  ) +
  geom_text(
    mapping = aes(label = hp),
    position = position_fill(vjust = 0.5),
    color = "white",
    size = 3
  ) +
  scale_y_continuous(name = "Share of Power", labels = scales::percent) +
  scale_fill_viridis_d(name = "Classification") +
  theme_minimal()
#> `summarise()` has grouped output by 'vs'. You can override using the `.groups`
#> argument.

Created on 2023-08-03 with reprex v2.0.2

René
  • 11
  • 4