I am frequently using Latex to use custom math expressions in titles and axis labels of R plots.
As described here, this can be achieved using the latex2exp package. Is it somehow possible to include Latex special fonts for mathmode?
Specifically, I am looking for a way to include \mathcal and \mathbb symbols in R plots.
Of these, \mathbb might be harder, because it requires a Latex package (usually amsfonts). According to this post, \mathcal does not require any Latex packages, but it still does not seem to work.
Here is an example:
library(ggplot2)
library(latex2exp)
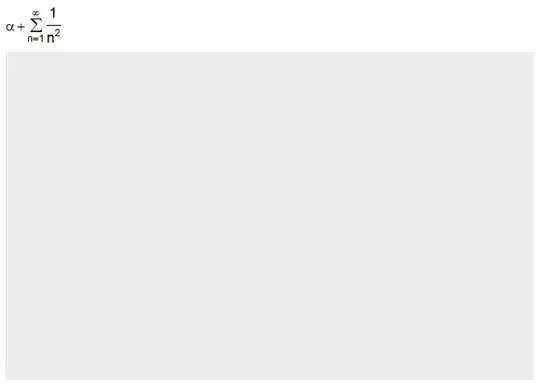
# this works:
ggplot() + ggtitle(TeX('$\\alpha + \\sum_{n = 1}^\\infty \\frac{1}{n^2}$'))
# this does not:
ggplot() + ggtitle(TeX('$\\mathcal{A} + \\mathbf{C}$'))

Created on 2023-08-04 with reprex v2.0.2
The same issue occurs in base R plotting, so it's not a ggplot issue.
According to the answer in this post, at least \mathbf should work as used above, but it doesn't for me. When I copy-paste the example from the reply and run it, the graphics device writes out "mathbf", as in my example above.