In a previous post the original poster asked a question on how to organize a series of scenarios with varying states and parameters for simulations with the deSolve package. A solution was given, but I wonder if it can be made easier in a pipeline-friendly style, but without the use of nested data frames. The goal is to use it as a teaching example using clear tabular data structures that can be fit to a final ggplot.
Approach 1: Classical "base-R" style
Until now, I usually use a list approach with the apply-function. The resulting list of data frames can then be fit to the deSolve::plot-method:
library("deSolve")

model <- function(t, y, p) {
  with(as.list(c(y, p)), {
    dN <- r * N * (1 - N/K)
    list(c(dN))
  })
}

times <- 0:10
y0    <- c(N = 0.5)         # state variables
p     <- c(r = 0.2, K = 1)  # model parameters

## run a single simulation
out <- ode(y0, times, model, p)
plot(out)

## create a data frame with some combinations of states and parameters
scenarios <- expand.grid(N = seq(0.5, 1.5, 0.2), K = 1, r = seq(0.2, 1, 0.2))

## a function to run a simulation for a single line of the data frame
## note difference between scenarios and scenario (plural/singular)
simulate <- function(scenario) {
  ## split scenario settings to initial states (y0) and parameters (p)
  y0 <- scenario["N"]
  p  <- scenario[c("r", "K")]
  ode(y0, times, model, p)
}

## MARGIN = 1: each row is a scenario
## simplify = FALSE: function should return a list
outputs <- apply(scenarios, MARGIN = 1, FUN = simulate, simplify = FALSE)

## the plot.deSolve method works with lists as second argument
plot(out, outputs)
Approach 2: A step towards a pipeline
Based on this example, I created a function simulate_inout that returns both, inputs and outputs in a ggplot-compatible way for a single scenario. This should then be called for all scenarios (all rows) in a pipeline.
The following works:
## version of simulate that preserves inputs and outputs
simulate_inout <- function(scenario) {
scenario <- unlist(scenario)
## split scenario settings to initial states (y0) and parameters (p)
y0 <- scenario["N"]
p <- scenario[c("r", "K")]
## integrate the model
output <- ode(y0, times, model, p)
## replicate rows of inputs
input <- do.call("rbind", replicate(length(times),
scenario, simplify = FALSE))
## return a data frame with inputs and outputs
cbind(input, output)
}
## a single scenario
simulate_inout(scenarios[1,])
simulate_all <- function(scenarios) {
## iterate over all rows
ret <- NULL
for (i in 1:nrow(scenarios)) {
ret <- rbind(ret, simulate_inout(scenarios[i,]))
}
data.frame(ret)
}
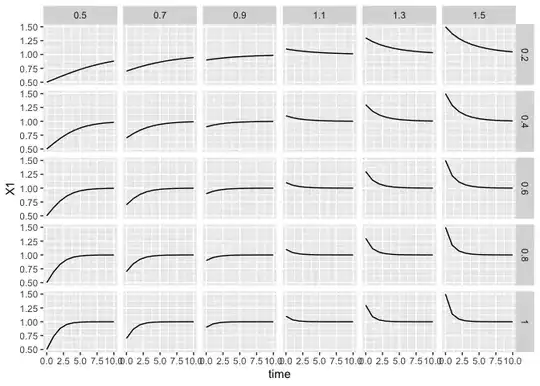
## plot with ggplot
library("ggplot2")
scenarios |> simulate_all() |> ggplot(aes(time, N.1)) +
geom_path() + facet_grid(r ~ N)
Question
I would like to streamline this code in consistent tidyverse style and to get of the for-loop in simulate_all and other specific tricks like do.call.