I am struggling with understanding how to add a second factor to an existing ggplot plot. I am obviously making a mapping error, but I cannot identify the error.
I want the levels of one factor represented by line type and color and the levels of the second factor by shape and color with the color assignment consistent across both factors.
I have no problem plotting the first factor and I can add the shape plot for the second factor. But, when I attempt to associate color with shape for the second factor, I either add the shapes to the already plotted lines or the colored lines get added to the shapes in the legend for the second factor.
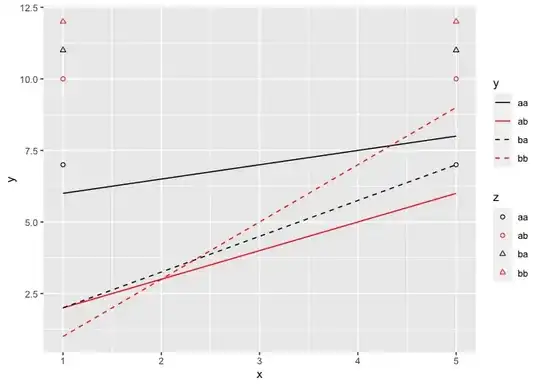
The final plot should have colored lines and separate colored shapes. The legend for factor y should show levels by line type and color; and the legend for factor z should show levels by shape and color.
Thank you for helping a newbie.
library(ggplot2)

# Example source data with two factors and two dependent variables
x <- x <- rep(c(1, 5), each = 4)
f1 <- as.factor(rep(c("a", "b"), each = 2, times = 2))  # Factor f1
f2 <- as.factor(rep(c("a", "b"), each = 1, times = 4))  # Factor f2
y <- c(6, 2, 2, 1, 8, 6, 7, 9)                          # Dependent variable y
z <- rep(c(7, 10, 11, 12), times = 2)                   # Dependent variable z
df <- data.frame(x, f1, f2, y, z)

# Combine factors to create single factor with 4 levels
df$f1_f2 <- as.factor(paste(df$f1, df$f2, sep = ""))

# Plot y with factor levels as combination of line type and line color
py <- ggplot(data = df, aes(x = x, y = y)) +
    geom_line(aes(linetype = f1_f2,
                  color = f1_f2)) +
    scale_linetype_manual(name = "y",
                       values = c("solid",
                                     "solid",
                                     "dashed",
                                     "dashed")) +
    scale_color_manual(name = "y",
                       values = c("black",
                                  "red",
                                  "black",
                                  "red"))

# Legend correctly shows factor levels
# Add z with factor levels as combination of shape type and shape color
pz <- py + geom_point(data = df, aes(x = x, y = z,
                                     shape = f1_f2)) +
    scale_shape_manual(name = "z",
                       values = c(1, 1, 2, 2))

# Legends show y correctly and z with correct shapes
# I'm stumped trying to link the color to shape so that the legend
#   for z shows only red and black circles and triangles and y legend is unchanged
# I end up either intermixing lines and shapes in the legend or the plot itself