1

I have the following code:

install.packages("tidyverse")
library("tidyverse")
data(diamonds)

ggplot(data=diamonds)+
  geom_point(mapping=aes(x=carat,y=price),color="blue")+
  geom_hline(aes(yintercept=max(price)),
             color="seagreen")+
  annotate("text",x=3.5,y=19600,label=
           scales::comma(max(diamonds$price),
                        accuracy=1),
                 size=5,color="seagreen",
           fontface="bold.italic")+
  facet_wrap(facets = "cut")

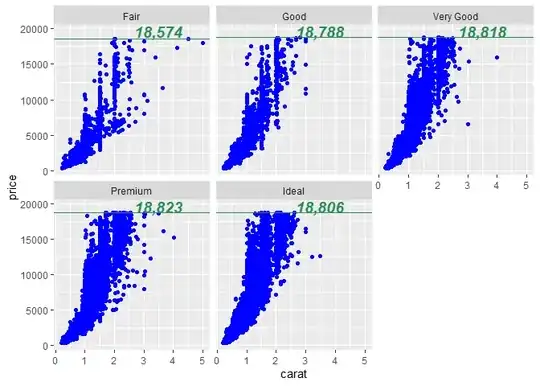
My current result is shown as the graphic below: enter image description here I want to facet each "cut" level, and show the prices against carats. With the geom_hline, I want to show the highest price in each facet. However, I do not know how to do it.

I have tried to look similar questions up, and found this post: Different `geom_hline()` for each facet of ggplot

The question is similar to mine, but I do not know how to follow the suggested solution: how do I separate each facet into different column? and is there a way to do it without modifying the orginal database?

Thanks everyone

stefan
  • 90,330
  • 6
  • 25
  • 51
Kiki Liu
  • 27
  • 3

1 Answers1

1

You can achieve this by creating a new dataframe with the highest prices for each cut

library(tidyverse)

max_prices <- diamonds %>%
  group_by(cut) %>%
  summarise(yintercept = max(price))

ggplot(data = diamonds) +
  geom_point(mapping = aes(x = carat, y = price), color = "blue") +
  geom_hline(data = max_prices, aes(yintercept = yintercept), color = "seagreen") +
  geom_text(data = max_prices, mapping = aes(x = 3.5, y = 19600, label = scales::comma(yintercept, accuracy = 1)), 
            size = 5, color = "seagreen", fontface = "bold.italic") +
  facet_wrap(facets = "cut")

Created on 2023-08-08 with reprex v2.0.2

Godrim
  • 449
  • 2
  • 10
  • Thanks a lot for this answer, but I would like to ask, why didn't the original "annotate" function work anymore? why did I have to change to geom_label. I tried annotate by myself, but it only apeeared error message – Kiki Liu Aug 08 '23 at 14:14
  • Someone else can correct me if I am wrong, but I have always understood/used annotate for adding single bits of text, and geom_text when you need multiple based on your actual data. https://r-graphics.org/recipe-scatter-labels https://r-graphics.org/recipe-annotate-text – Godrim Aug 09 '23 at 06:02