I've got input_values as a tibble: input_values
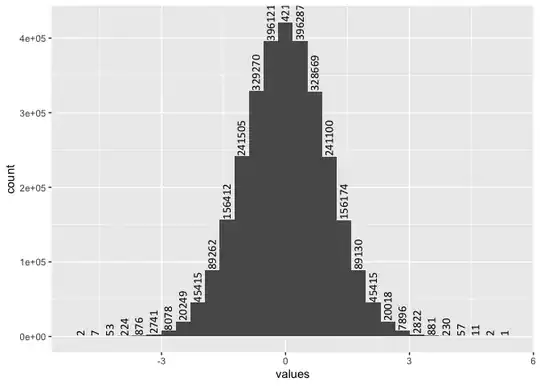
For these alues I'd like to plot a histogram, where the columns are labeled (90° angle, almost directly on top of the colums).
as_tibble(input_values) %>% ggplot(aes(x = values) + geom_histogram(stat = "bin") + stat_bin(geom='text', angle = 90, family = "Calibri", hjust=-1, vjust=0.4, aes(label=..count..))
](https://i.stack.imgur.com/MOMh7.png)
the label is always positioned too high. I reckon something like "stat_bin(..., position = position_nudge(y = ..count..*-0.1)) would do the trick. But I cannot address my count values in this manner, for the x it seems to work, see here
I tried also stat = count, position = position_nudge(y = 1000) etc. but it didn't work because the labels are more further up, the higher the count was.