I've been trying to make this ggplot barchart in R using a yearmon variable (from lubridate) on the x-axis and then a numeric variable on the y-axis.
In my dataframe, I converted date to yearmon and added the yearmon values as a new column in the dataframe
#Make a yearmon variable for the Health dataframe
Discharge.Date <- ym(Health$Discharge.Month)
Health <- mutate(Vizient, Discharge.Date, .before = Hospital)
Health$Discharge.Date <- as.yearmon(Health$Discharge.Date, "%Y-%m")
Then I filtered the Health dataframe for a specific hospital. Lets call it "xyz".
xyz <- filter(Vizient, Hospital == "xyz")
xyz1 <- as.data.frame(xyz)

Then I used this ggplot command.
ggplot(xyz1, aes(x=Discharge.Date, y=Cases)) + geom_bar(stat = "identity") + scale_x_yearmon() + xlab("Discharge Month") + ggtitle("xyz Monthly ACS Cases") + theme(plot.title = element_text(hjust = 0.5))
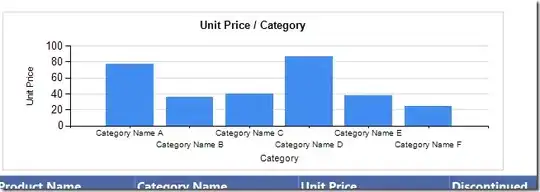
However, I don't understand why the bars aren't coming from the x-axis rather than the y-axis.
Interestingly, it works fine when I use x=Discharge.Month (the Date variable) instead of x=Discharge.Date (the yearmon variable)
This is all really weird because the graph was being plotted correctly when I was writing the script a year ago.
Everything is explained above. Thank you :)