0

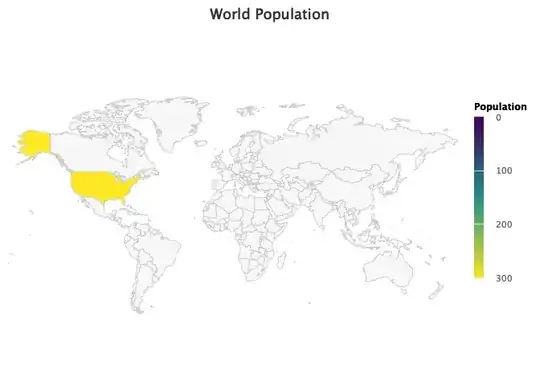
I have a problem with this code. The map appears but without color. I have installed tidiverse, highcharter, geonames,ggplot2, gganimate, maps, ggmap. Should I install some more packages?

population<-baza %>% 
  select(Country, Population)


highchart() %>% 
  hc_add_series_map(worldgeojson, df=population, value="Population", joinBy = "Country") %>% 
  hc_colorAxis(stops=color_stops()) %>% 
  hc_title(text="World Population") %>% 
  hc_tooltip(useHTML = TRUE,
             formatter = JS(
               "function(){",
               "  return '<b><u>'+this.point.Country+'</u></b><br>'",
               "         +'<b>Population:</b> '+parseInt(this.point.value);",
               "}"
             )
  ) %>% 
  hc_legend(
    enabled = TRUE,
    title = list(text = "Population"),
    layout = "vertical",
    align = "right",
    verticalAlign = "middle"
  )

Baza is my data frame with columns Country and Population. Should something be added to this code?

stefan
  • 90,330
  • 6
  • 25
  • 51
  • Welcome to SO! It would be easier to help you if you provide [a minimal reproducible example](https://stackoverflow.com/questions/5963269/how-to-make-a-great-r-reproducible-example) including a snippet of your data or some fake data, e.g. run `dput(head(population))` and add the output to your post. – stefan Aug 11 '23 at 06:10

1 Answers1

0

The issue has nothing do to with any missing packages, e.g. highcharter does not require ggplot2, gganimate, ... If a package is missing R will in general complain about that with an error message. And when you install a package using install.packages all needed dependency package will in general get installed too.

The most likely issue is that your dataset population can't be merged to the geojson data which might e.g. happen when you misspecified the joinBy column.

I had a look at the docs (?hc_add_series_map) and guessing that you use the worldgeojson data provided by highcharter the issue is that the worldgeojson data has no property Country, e.g. the country name is stored in a property name, the ISO3 country code in a property named iso3, ...

Hence, in that case a fix to your issue would be to rename your Country column.

Using some fake example population data where I assumed that Country contains the country name:

library(highcharter)
library(dplyr)

population <- data.frame(
  Country = "United States of America",
  Population = 300
)

population <- population |> 
  rename(name = Country)

data(worldgeojson, package = "highcharter")

highchart() %>% 
  hc_add_series_map(worldgeojson, df = population, value = "Population", joinBy = "name") %>%
  hc_colorAxis(stops = color_stops()) %>%
  hc_title(text = "World Population") %>%
  hc_tooltip(
    useHTML = TRUE,
    formatter = JS(
      "function(){",
      "  return '<b><u>'+this.point.Country+'</u></b><br>'",
      "         +'<b>Population:</b> '+parseInt(this.point.value);",
      "}"
    )
  ) %>%
  hc_legend(
    enabled = TRUE,
    title = list(text = "Population"),
    layout = "vertical",
    align = "right",
    verticalAlign = "middle"
  )

stefan
  • 90,330
  • 6
  • 25
  • 51