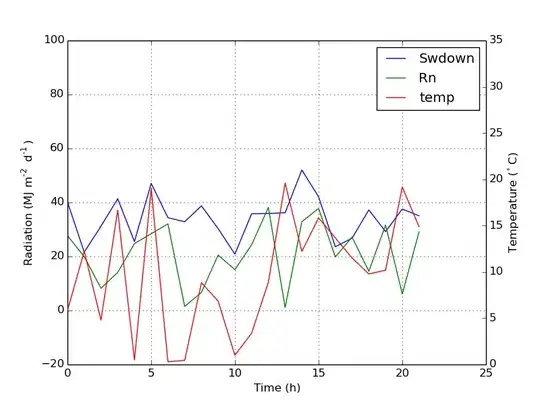
I want to create a boxplot with two y axis (both continuous with different scales) and a factor as x axis. Ideally, there should be a box of each continuous variable for each level of the factor. I would need a boxplot like this one, described in the first answer of this question. But in R.
So far, I adapted the code in this example to include boxplots and dotplots. However, I can´t make the plots of the second variable appear next to the previous ones instead of underneath.
data <- data.frame(Factor1=factor(c("A", "B","A", "B","A", "B","A", "B", "A", "B","A",     "B","A", "B","A", "B", "A", "B","A", "B", "A", "B", "A", "B","A", "B", "A", "B","A", "B","A",     "B","A", "B", "A", "B")), Cont1=rnorm(36, mean=100, sd= 15), Cont2=rnorm(36, mean=0.35, sd=0.05))

par(mar=c(5, 4, 4, 6) + 0.5)

## Plot first continuous variable
# Boxplot
boxplot(Cont1 ~ Factor1, data = data, col="white", boxcol=2, xlim=c(0.5, 3.5 + length(unique(data$Factor1))),axes=FALSE, xlab="", ylab="")

# Points
stripchart(Cont1 ~ Factor1, data = data,method = "jitter",pch = 19,col = 2,vertical = TRUE,add = TRUE)

mtext("Cont1", side=2, line=2.5, col=2)
box()
axis(2, col=2, col.axis=2,las=1)  ## las=1 makes horizontal labels


## Allow a second plot on the same graph
par(new=TRUE)

## Plot the second continuous variable
# Boxplot
boxplot(Cont2 ~ Factor1, data = data, col="white", boxcol=3,xlim=c(0.5, 5.5), axes=FALSE, xlab="", ylab="") # with these limits the new boxplot and dotplot shows up below the previous ones, rather than next to them

# Points
stripchart(Cont2 ~ Factor1, data = data,method = "jitter", pch = 19, col = 3, vertical = TRUE, add = TRUE)
## a little farther out (line=4) to make room for labels
mtext("Cont2", side=4,col=3,line=4)
axis(4, col=3,col.axis=3,las=1)

## Draw the factor axis
mtext("Factor1", side=1, col="black", line=2.5)

I would be happy hearing about how to improve this code, but also with new suggestions.

Thanks!

