0

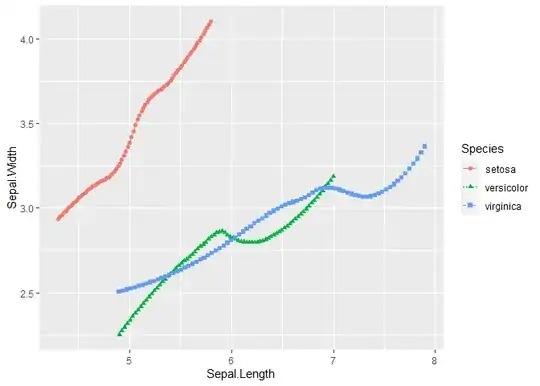
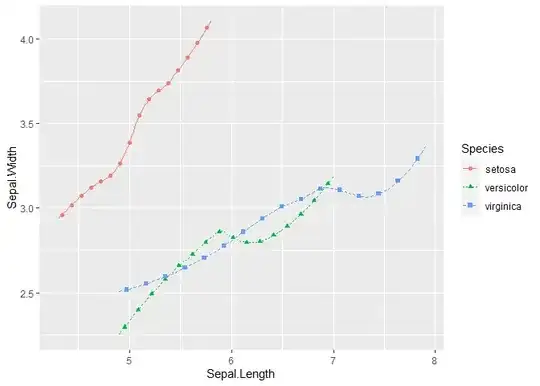
I making an smoothed line plot which as 8 lines in R studio. I was able to define different line types such as solid, dashed,....etc,. But I want all lines to be solid with different shapes (such as diamond, star, circle, filled circle,...ect,.) as an line distinguisher. As it's a smoothened line I can't use normal geom_point layer to get the results.

My code is

custom_line_types <- c("solid", "dashed", "dotted", "dotdash", "longdash", "twodash", "22", "13")

my_theme <- theme_minimal() + 
  theme(
    panel.border = element_rect(color = "black", fill=NA, size=1),
    plot.background = element_rect(color = "black", fill = NA, size = 1),
    plot.margin = margin(20, 20, 20, 20),
    panel.grid.major = element_blank(), 
    panel.grid.minor = element_blank(),
    axis.line = element_line(color="black"),
    axis.text = element_text(color="black"),
    axis.ticks = element_line(color="black"),
    axis.ticks.length = unit(2.5, "mm"),
    ggh4x.axis.ticks.length.minor = rel(0.5)
  )

ggplot(df_plot, aes(x = z_position, y = mean_temp, linetype = file_name, color = file_name)) +
  my_theme +
  geom_smooth(method = "loess", span = 0.1, degree = 2, se = FALSE, size = 1) +
  scale_linetype_manual(name = "Edcuts flow rate", values = custom_line_types) +
  scale_color_manual(name = "Edcuts flow rate", values = rep("black", length(custom_line_types))) +
  labs(x = "Distance", y = "Temperature in °C") +
  theme(
    legend.position = c(0.898, 0.14),
    axis.text = element_text(size = 12),
    axis.title = element_text(size = 14),
    plot.title = element_text(size = 18),
    legend.text = element_text(size = 11, face = "plain"),
    legend.title = element_text(size = 14),
    legend.background = element_rect(color = "black", size = 0.6, fill = NA)
  ) +
  guides(color = guide_legend(ncol = 2), fill = guide_legend(ncol = 2)) +
  scale_x_continuous(minor_breaks = seq(0, max(df_plot$z_position) + 10, by = 10), guide = guide_axis_minor()) +
  scale_y_continuous(minor_breaks = seq(0, max(df_plot$mean_temp) + 10, by = 10), guide = guide_axis_minor())

Smoothened line with different shapes as an distinguisher like attached image

M--
  • 25,431
  • 8
  • 61
  • 93
Subu
  • 1
  • image link "http://www.cookbook-r.com/Graphs/Shapes_and_line_types/figure/unnamed-chunk-3-1.png" – Subu Aug 14 '23 at 14:03
  • 1
    It's easier to help you if you include a simple [reproducible example](https://stackoverflow.com/questions/5963269/how-to-make-a-great-r-reproducible-example) with sample input that can be used to test and verify possible solutions. Please remove all non-essential theme commands as such to make the issue clear with as little runnable code as possible. – MrFlick Aug 14 '23 at 14:07
  • Rather than `linetype = file_name`, try `shape = file_name` – MrFlick Aug 14 '23 at 14:09
  • Welcome to SO! You maximise your chance of getting a useful answer if you provide a minimal reproducible example. [This post](https://stackoverflow.com/help/minimal-reproducible-example) may help. Here, we need sight of your data, ideally via `dput(df_plot)` or §dput(head(df_plot))`. Apart from that, your question is clear and you have provided your code. – Limey Aug 15 '23 at 07:21

1 Answers1

1

You are right. You can't add shapes or points to a smoothed line using a default geom_point which uses stat="identity". But you could do so by switching to stat="smooth" or as I do below using stat_smooth with geom="point".

Using iris as example data:

library(ggplot2)

p <- ggplot(iris, aes(
  x = Sepal.Length, y = Sepal.Width,
  linetype = Species, color = Species, shape = Species
)) +
  geom_smooth(
    method = "loess",
    se = FALSE,
    linewidth = .25
  )

p +
  stat_smooth(
    geom = "point", method = "loess",
    se = FALSE
  )
#> `geom_smooth()` using formula = 'y ~ x'

However, this makes for a cluttered plot as we get a point and shape for each x value of the smoothed line computed by stat_smooth.

One option to fix that would be to use stage() and an if_else to add a shape to e.g. every fifth point of the smoothed line only, where in the code below I start with the third, hence the condition seq_along(x) %% 5 == 3.

p + stat_smooth(
  aes(
    shape = stage(Species,
      after_stat = dplyr::if_else(seq_along(x) %% 5 == 3, shape, NA)
    )
  ),
  geom = "point", method = "loess",
  se = FALSE
)
#> `geom_smooth()` using formula = 'y ~ x'
#> Warning: Removed 192 rows containing missing values (`geom_point()`).

stefan
  • 90,330
  • 6
  • 25
  • 51