1

I have plotted 2 lines on a graph using ggplot, specially using the "select" and "gather" tools to collapse the two line variables into key-value pairs using this method (solution 2 on here): https://www.datanovia.com/en/blog/how-to-create-a-ggplot-with-multiple-lines/

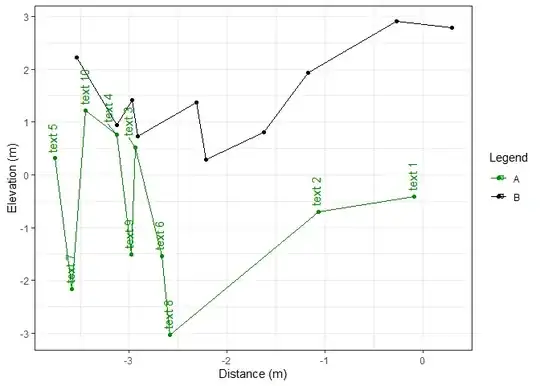
Everything works except I can't figure out how label the points of just ONE line using the "Desc" variable. The following code labels both lines with the Desc variable, but I only want to label the "elevation" line. Any ideas?

#preparing data
library("tidyverse")
df <- mydatacsv %>%
select(Meter, Stem_Height,Elevation,Desc) %>%
gather(key = "Legend", value = "value", -Meter,-Desc)
head(df,n=200)


# Visualization
ggplot(df, aes(x = Meter, y = value,label=Desc)) + 
geom_line(aes(color = Legend)) + 
scale_color_manual(values = c("green4","black")) +
geom_point(data=mydatacsv, aes(y = Stem_Height),color="green4")+
geom_point(data=mydatacsv, aes(y = Elevation),color="black")+
xlab("Distance (m)") +
ylab("Elevation (m)")+
geom_text_repel(max.overlaps=Inf,hjust=-0.1, angle=90)

I wanted two lines plotted, with plot point labels for just one line. Instead it is putting double-labels on the graph, one for each plot point on each line.

stefan
  • 90,330
  • 6
  • 25
  • 51
MattS5000
  • 11
  • 1

2 Answers2

2

You could label the desired group only in at least three ways.

Using example data mtcars and plotting hp vs mpg for each gear level, but labelling only observations for cars with three gears:

  1. setting the label text according to the value of gear:
    mtcars |>
      ggplot() +
      geom_text(aes(hp, mpg, label = ifelse(gear == 3, mpg, NA)))
  1. feeding a label layer its own subset of data:
    mtcars |>
      ggplot() +
      geom_text(data = mtcars |> filter(gear == 3),
                aes(hp, mpg, label = mpg)
                )
  1. setting alpha (opacity) to zero for unwanted labels:
mtcars |>
  ggplot() +
  geom_text(aes(hp, mpg, label = mpg, alpha = gear == 3)) +
  scale_alpha_identity()
I_O
  • 4,983
  • 2
  • 2
  • 15
0

Since you are using the tidyverse packages, mutate the labels you don't want to either NA or blanks "". Any of the two will remove the labels of one line, NA's will issue a warning.
I assume you have the data in the long format. Though you have reshaped it in the beginning of the question's code, you plot it as if it were not.

suppressPackageStartupMessages({
  library(dplyr)
  library(ggplot2)
  library(ggrepel)
})

# reproducible test data
set.seed(2023)
df1 <- replicate(2, cumsum(rnorm(20))) |> as.data.frame()
df1$Legend <- rep(c("A", "B"), each = 10L)
df1$Desc <- with(df1, ave(V1, Legend, FUN = \(x) paste("text", seq_along(x))))
names(df1)[1:2] <- c("Meter", "value")
head(df1)
#>         Meter      value Legend   Desc
#> 1 -0.08378436 -0.4116530      A text 1
#> 2 -1.06672810 -0.7059802      A text 2
#> 3 -2.94179542  0.5125938      A text 3
#> 4 -3.12794008  0.7567052      A text 4
#> 5 -3.76142578  0.3115533      A text 5
#> 6 -2.67062832 -1.5362504      A text 6

df1 %>%
  # mutate(Desc = ifelse(Legend == "A", Desc, NA_character_)) %>%
  mutate(Desc = ifelse(Legend == "A", Desc, "")) %>%
  ggplot(aes(Meter, value, color = Legend, label = Desc)) +
  geom_line() +
  geom_point() +
  geom_text_repel(max.overlaps=Inf,hjust=-0.1, angle=90) +
  scale_color_manual(values = c("green4", "black")) +
  xlab("Distance (m)") +
  ylab("Elevation (m)") +
  theme_bw()

Created on 2023-08-14 with reprex v2.0.2

Rui Barradas
  • 70,273
  • 8
  • 34
  • 66